Monitoring PuppyGraph with Prometheus
Summary
In this guide you will:
- Start PuppyGraph with metrics enabled using Docker Compose;
- Launch Prometheus with a ready-to-use scrape configuration;
- Confirm that PuppyGraph metrics are being collected.
Prerequisites
- Docker and Docker Compose installed and available on your machine. Confirm with
docker --versionanddocker compose version.
Prepare the Example Configuration
Prometheus Scrape Configuration
Save the following file as prometheus.yml inside your working directory:
global:
  scrape_interval: 15s
  evaluation_interval: 15s

scrape_configs:
  - job_name: puppygraph
    metrics_path: /metrics
    static_configs:
      - targets: ["puppygraph:8081"]
    basic_auth:
      username: puppygraph
      password: puppygraph123
- The target points to the
puppygraphservice name defined in Docker Compose. - Basic authentication uses the default PuppyGraph credentials. Update both the PuppyGraph admin password and this configuration before running in production.
Docker Compose
Save the following file as docker-compose.yml in the same directory, updating the Prometheus volume path to match where you stored prometheus.yml:
version: "3.8"

services:
  puppygraph:
    image: puppygraph/puppygraph:0.96
    container_name: puppygraph
    ports:
      - "8081:8081"
    environment:
      - METRICS_ENABLED=true

  prometheus:
    image: prom/prometheus:latest
    container_name: prometheus
    ports:
      - "9090:9090"
    volumes:
      - ./prometheus.yml:/etc/prometheus/prometheus.yml

networks:
  default:
    driver: bridge
- Replace
./prometheus.ymlwith the relative or absolute path to the file you created (use./prometheus.ymlif both files live in the same folder). - Ensure the PuppyGraph container runs with
METRICS_ENABLED=trueso the/metricsendpoint remains available. - This compose file enables the PuppyGraph metrics endpoint and mounts the Prometheus configuration so the scraper can discover PuppyGraph automatically.
Launch the Stack
 Start the services:
Confirm that both containers are healthy:
PuppyGraph exposes its UI at http://localhost:8081 and Prometheus at http://localhost:9090.
Verify Metrics Collection
Sign in to PuppyGraph at http://localhost:8081 using the default credentials (puppygraph / puppygraph123).
Open Prometheus at http://localhost:9090 and check the Status → Targets page to verify that the puppygraph job is up.
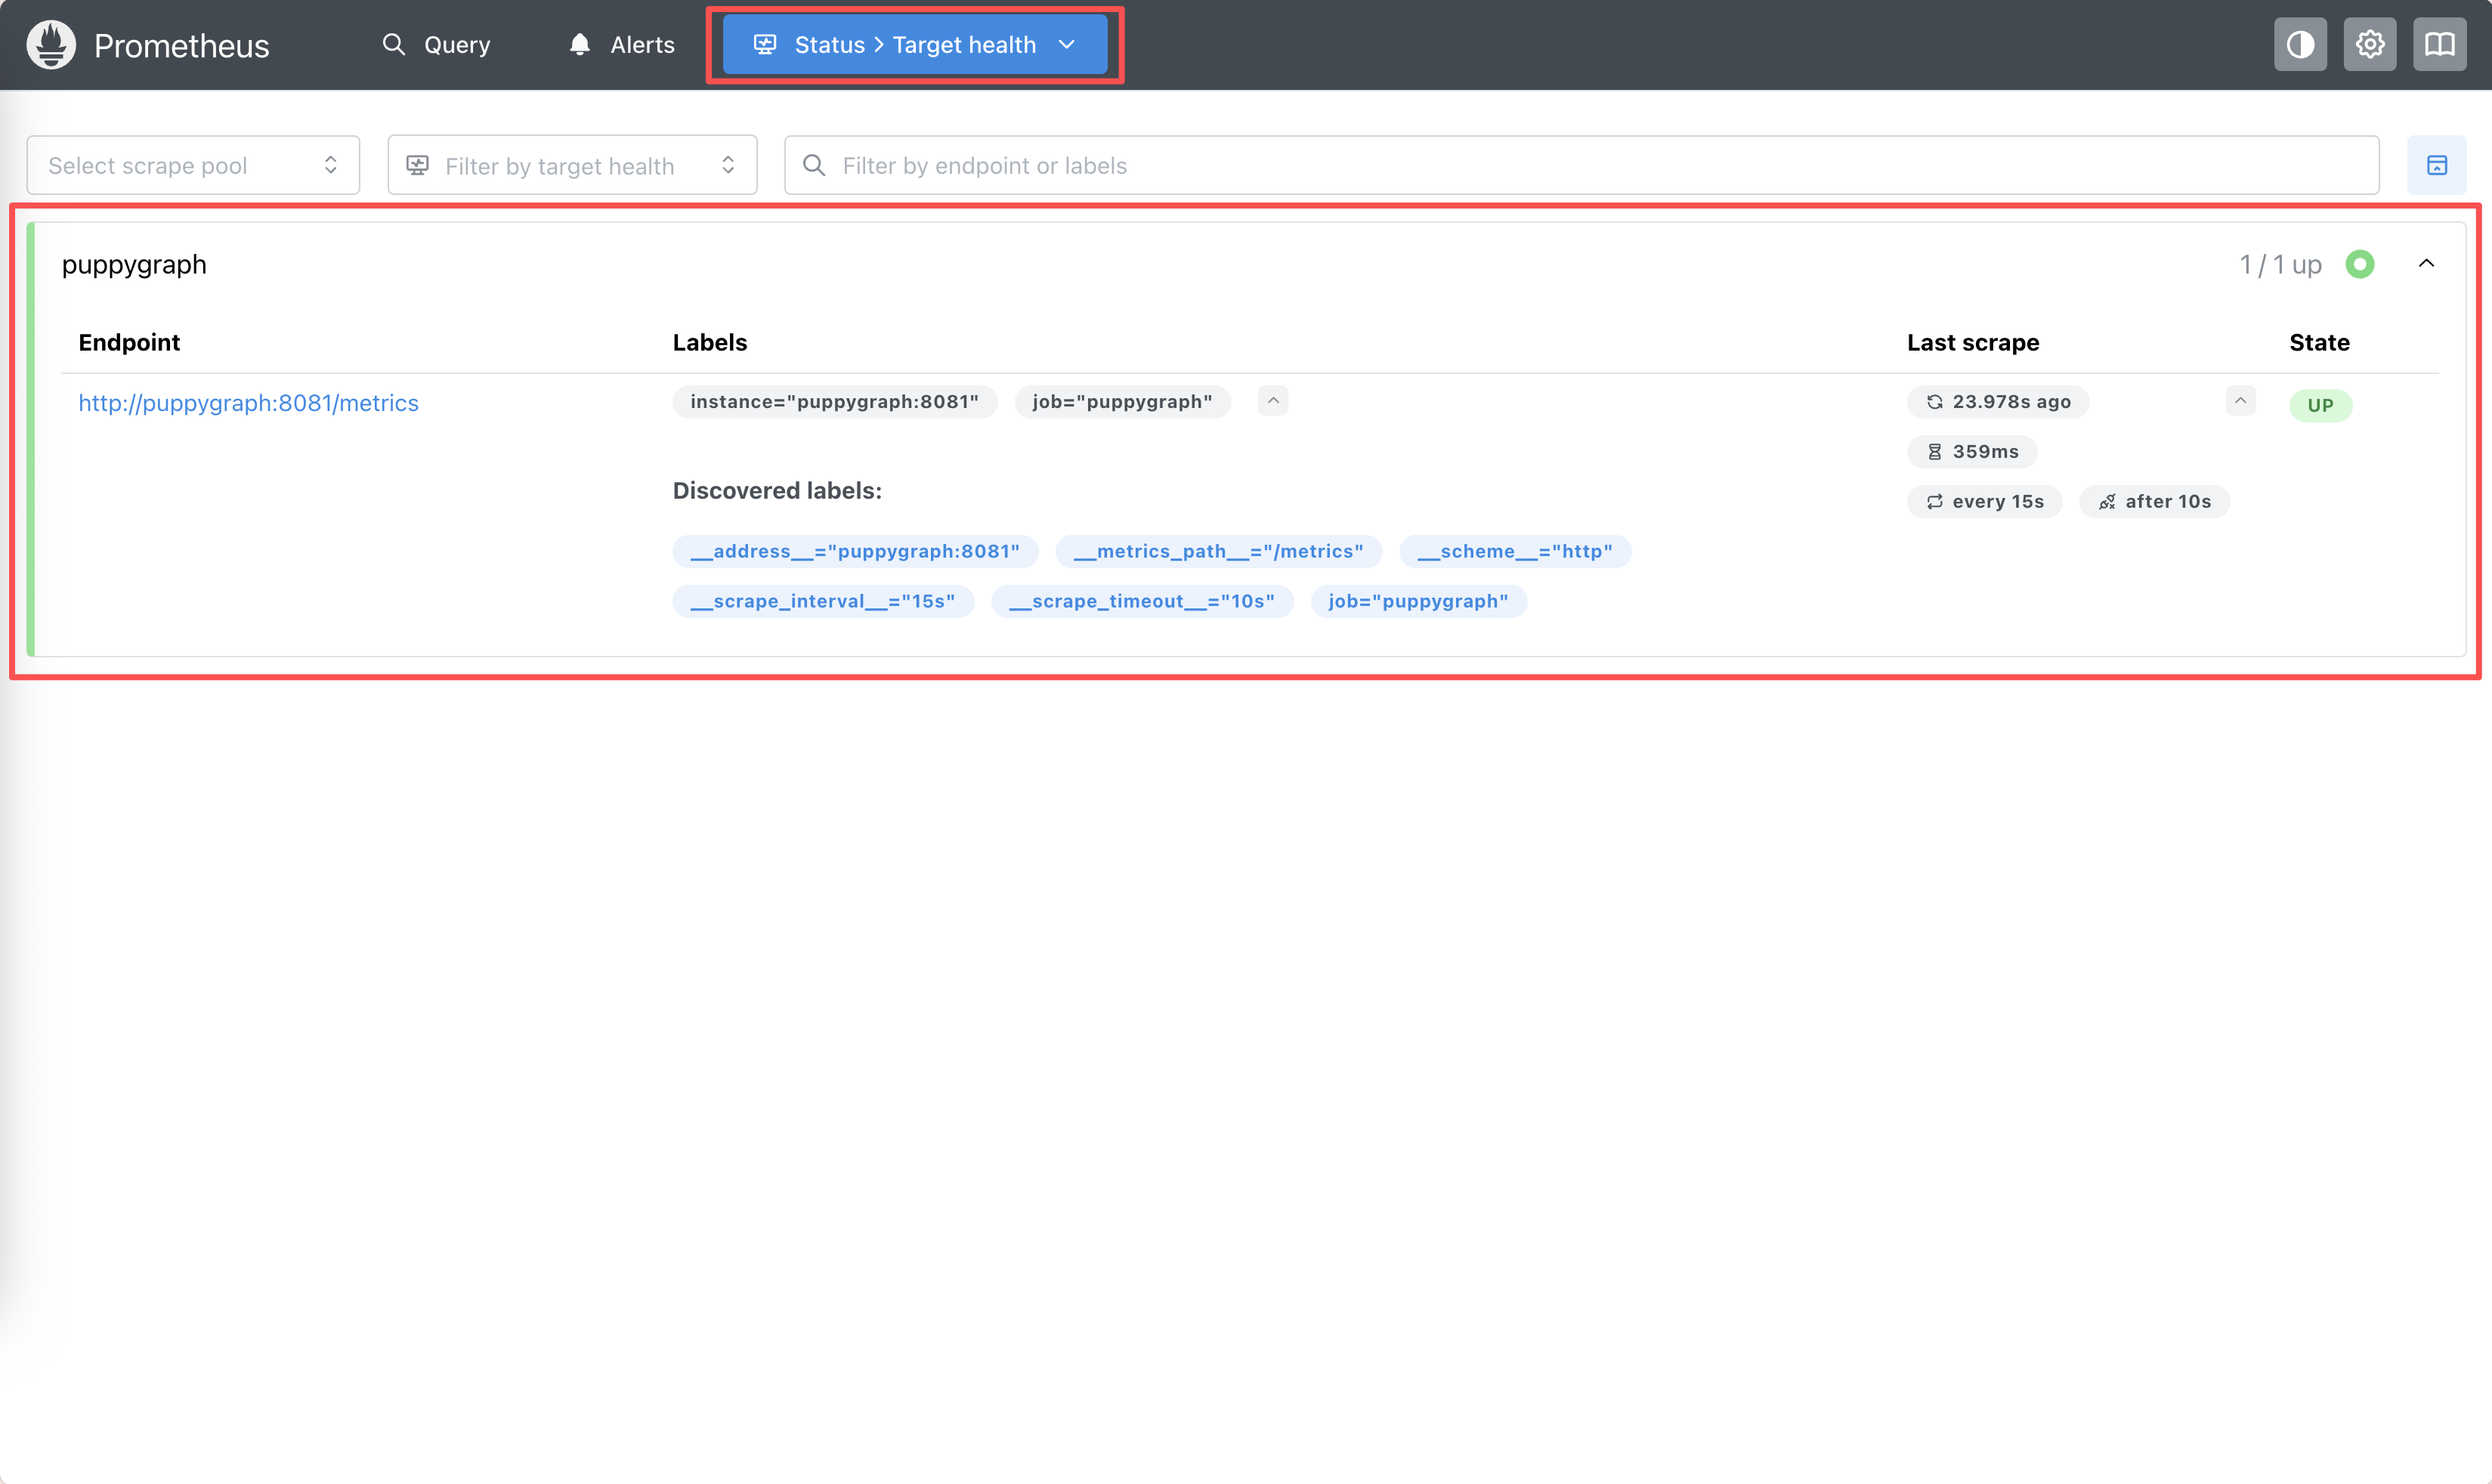
The puppygraph target should display state UP when metrics are being scraped successfully.
Return to the Prometheus home page, enter a PuppyGraph metric such as puppy_compute_node_mem_consumption_bytes in the Expression field, and click Execute.
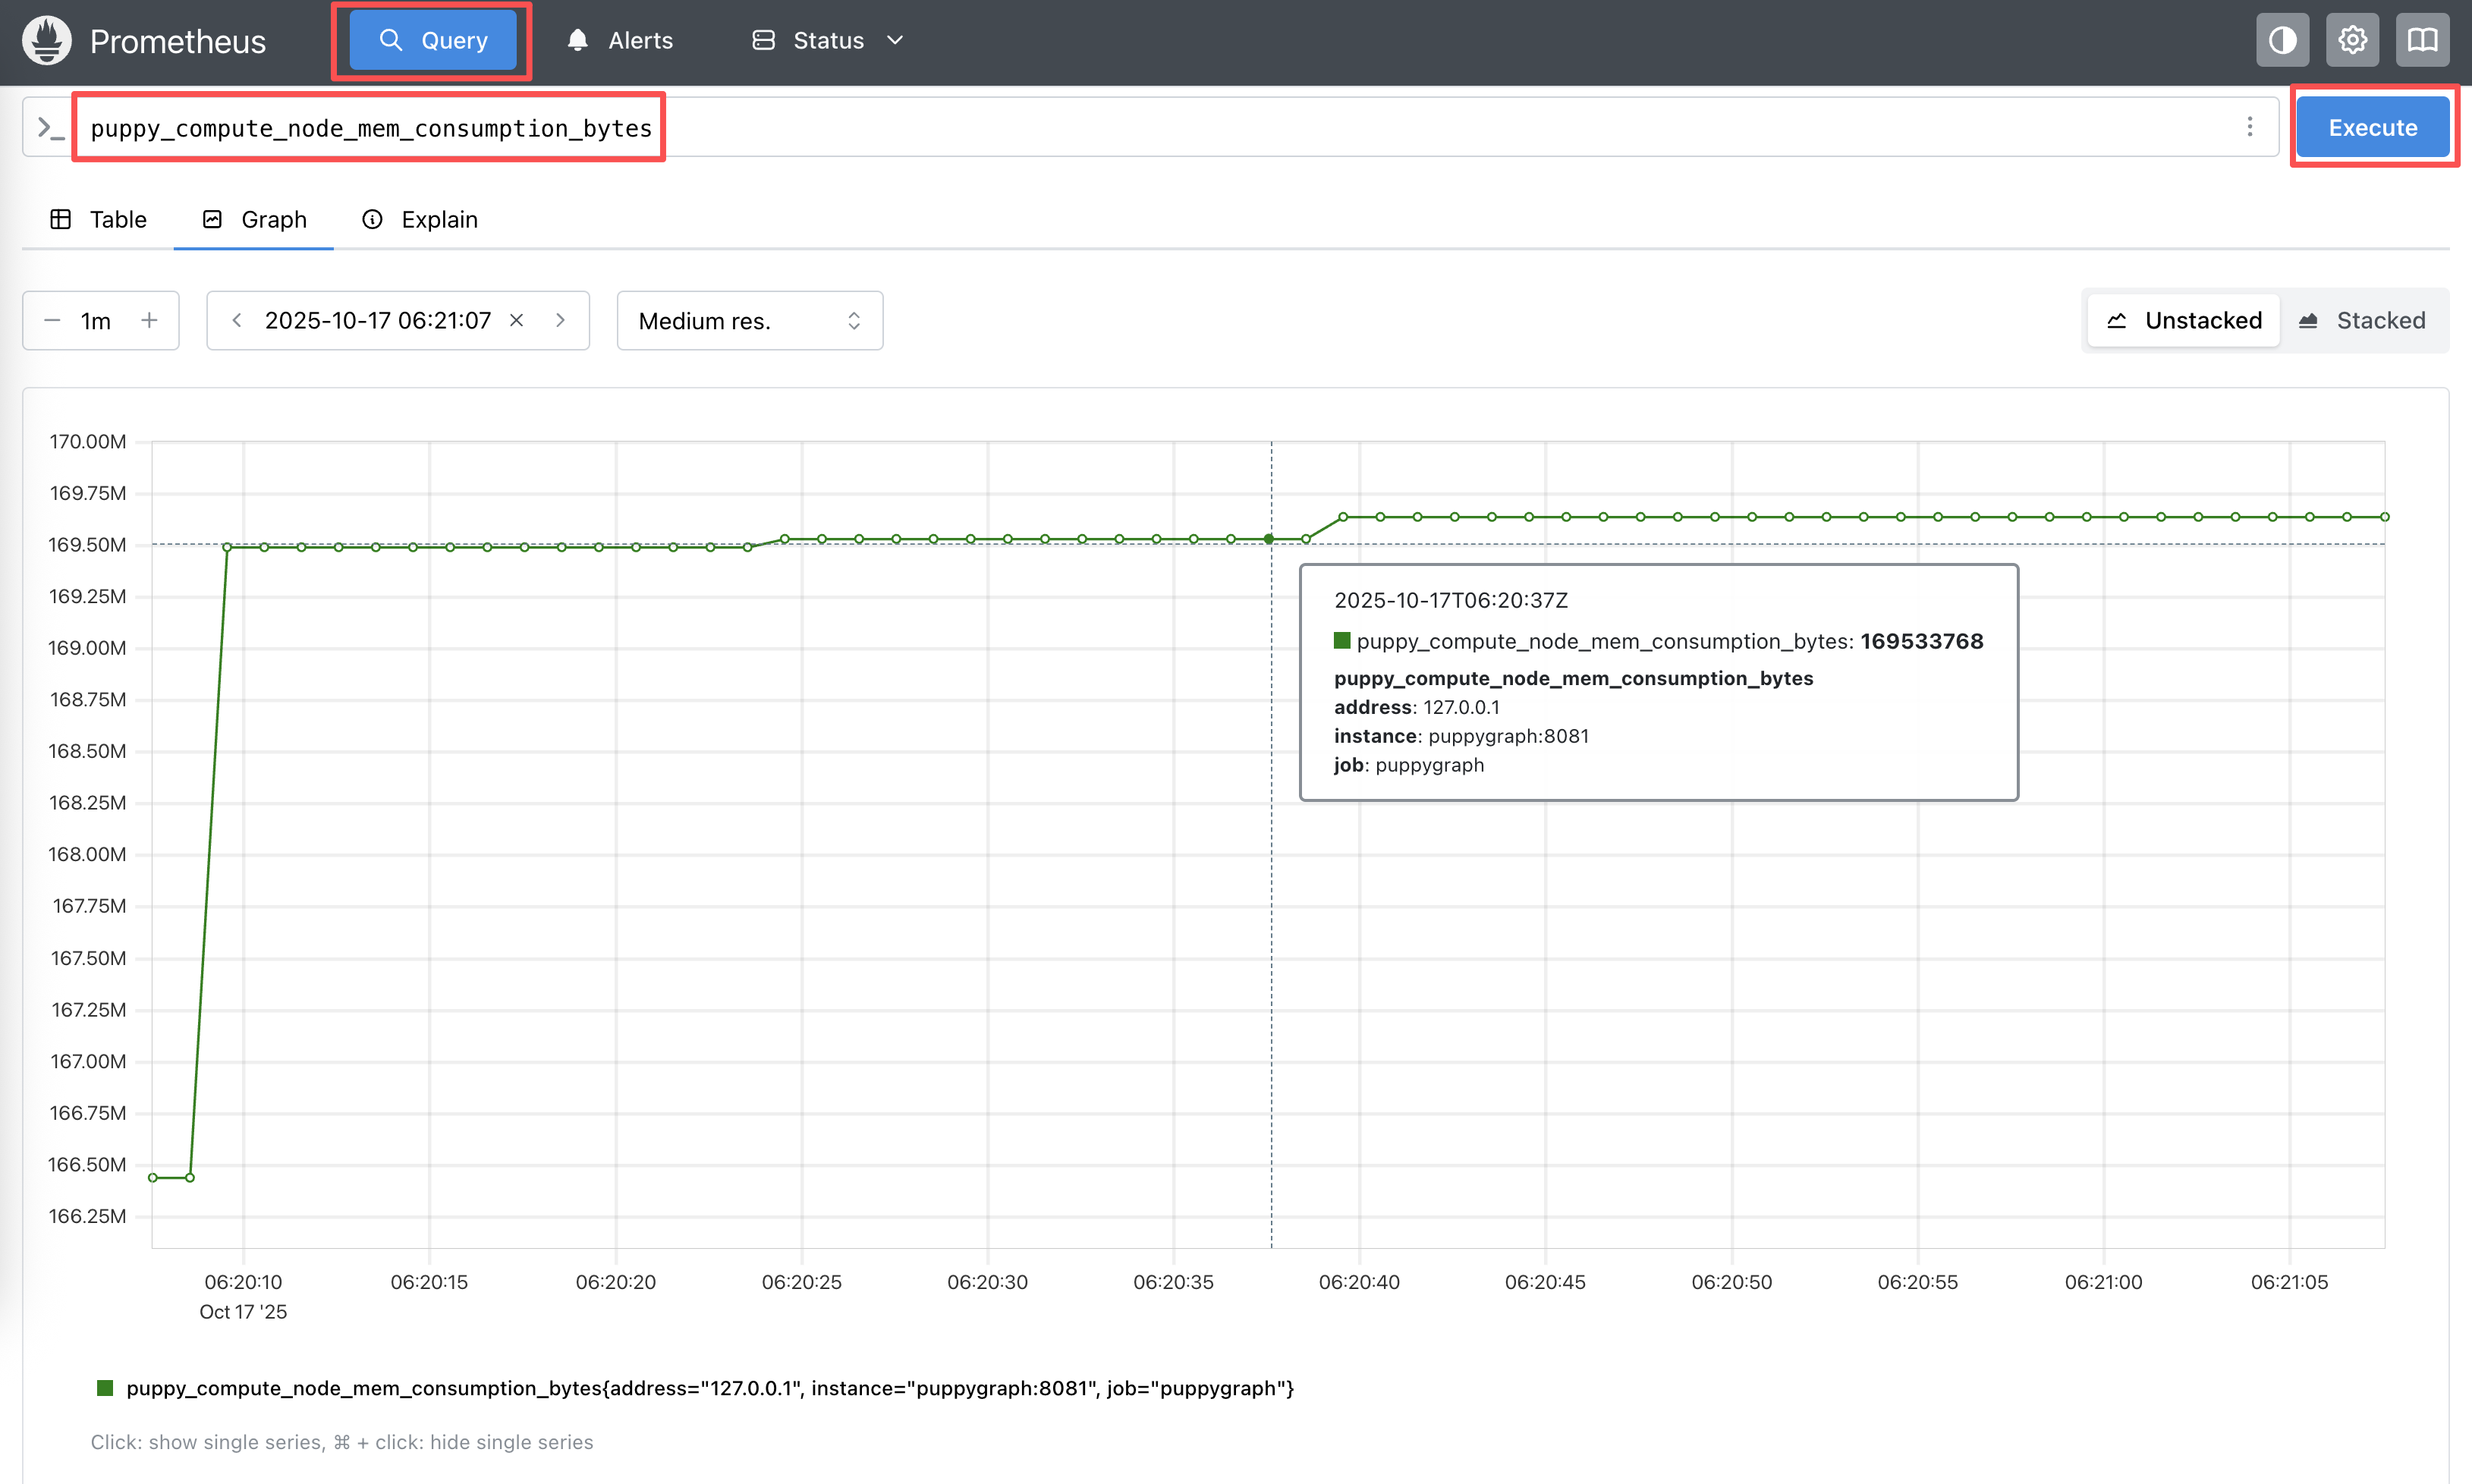
Query results confirm that Prometheus is reading PuppyGraph metrics from the /metrics endpoint.
If you see the target in the UP state and samples returned for your query, Prometheus is successfully scraping PuppyGraph.