Dashboard
PuppyGraph's Dashboard is a customizable grid of tiles for sharing high-level views of the graph. Each tile is backed by a graph query (Cypher by default; Gremlin also supported), so the same dashboard can mix counts, sample rows, and embedded query results.
To develop and test a tile's query before saving it, use the Query UI. For the query languages themselves, see Querying.
Default tiles
A fresh dashboard starts with five default tiles, populated from whatever schema is currently loaded.
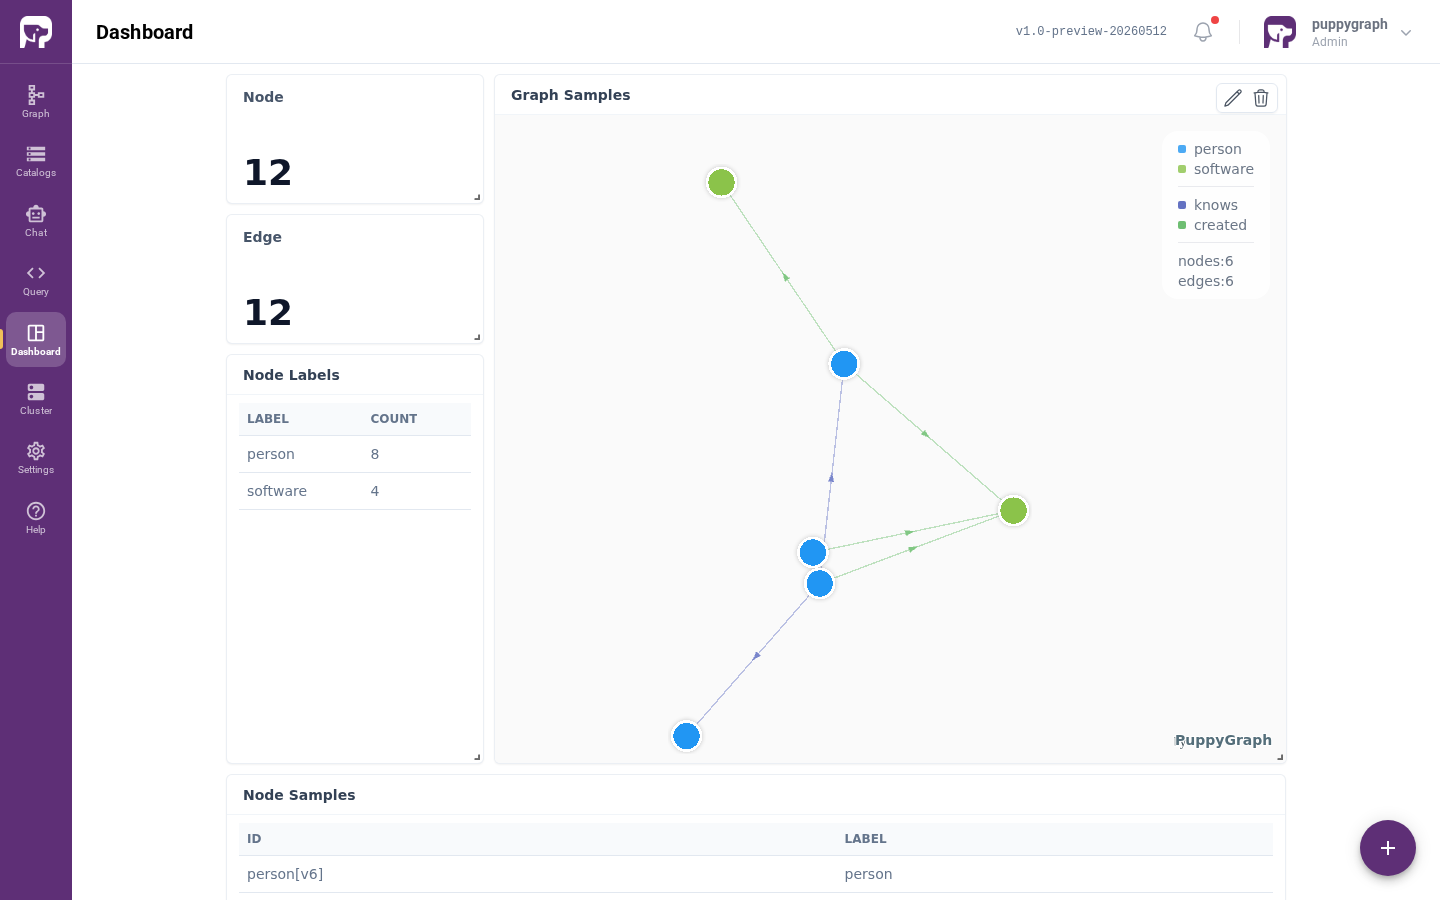
| Tile | Type | Purpose |
|---|---|---|
| Node | Text | Total number of nodes in the graph. |
| Edge | Text | Total number of edges. |
| Node Labels | Table | Node-label breakdown with per-label counts. |
| Graph Samples | Graph | Visual sample of nodes and edges. |
| Node Samples | Table | Properties of the sampled nodes. |
Dashboard management
Adding a tile
Click the floating + button in the lower-right corner of the dashboard.
Editing, moving, deleting, and resizing tiles
Hover over a tile's header to surface the per-tile action icons.

- Edit: click the pencil icon. The tile-edit form opens with the title, query, and display-type controls.
- Delete: click the trash icon.
- Move: drag the tile by its title area.
- Resize: drag the lower-right corner of the tile.
Editing a tile
When you open the tile-edit form, three fields drive the tile:
- Tile Title — what's displayed on the tile.
- Query — the graph query whose result the tile renders. Cypher is the default; switch to Gremlin in the language selector.
- Display Type — how the result is rendered. Three options:
| Display Type | Best for | Example |
|---|---|---|
| Text | A single scalar value (count, status, label). | The default Node and Edge tiles. |
| Graph | Nodes, edges, and paths. Three layout options: Radial, Vertical, Force. | The default Graph Samples tile. |
| Table | Properties of nodes / edges, or any tabular result. | The default Node Labels and Node Samples tiles. |