PuppyGraph Web UI
PuppyGraph provides a web-based UI for graph modeling, querying, visualization, and cluster management.
This guide introduces the main pages of the Web UI. For programmatic access, see PuppyGraph CLI and Client Drivers.
To use the UI, make sure your browser meets the System Requirements.
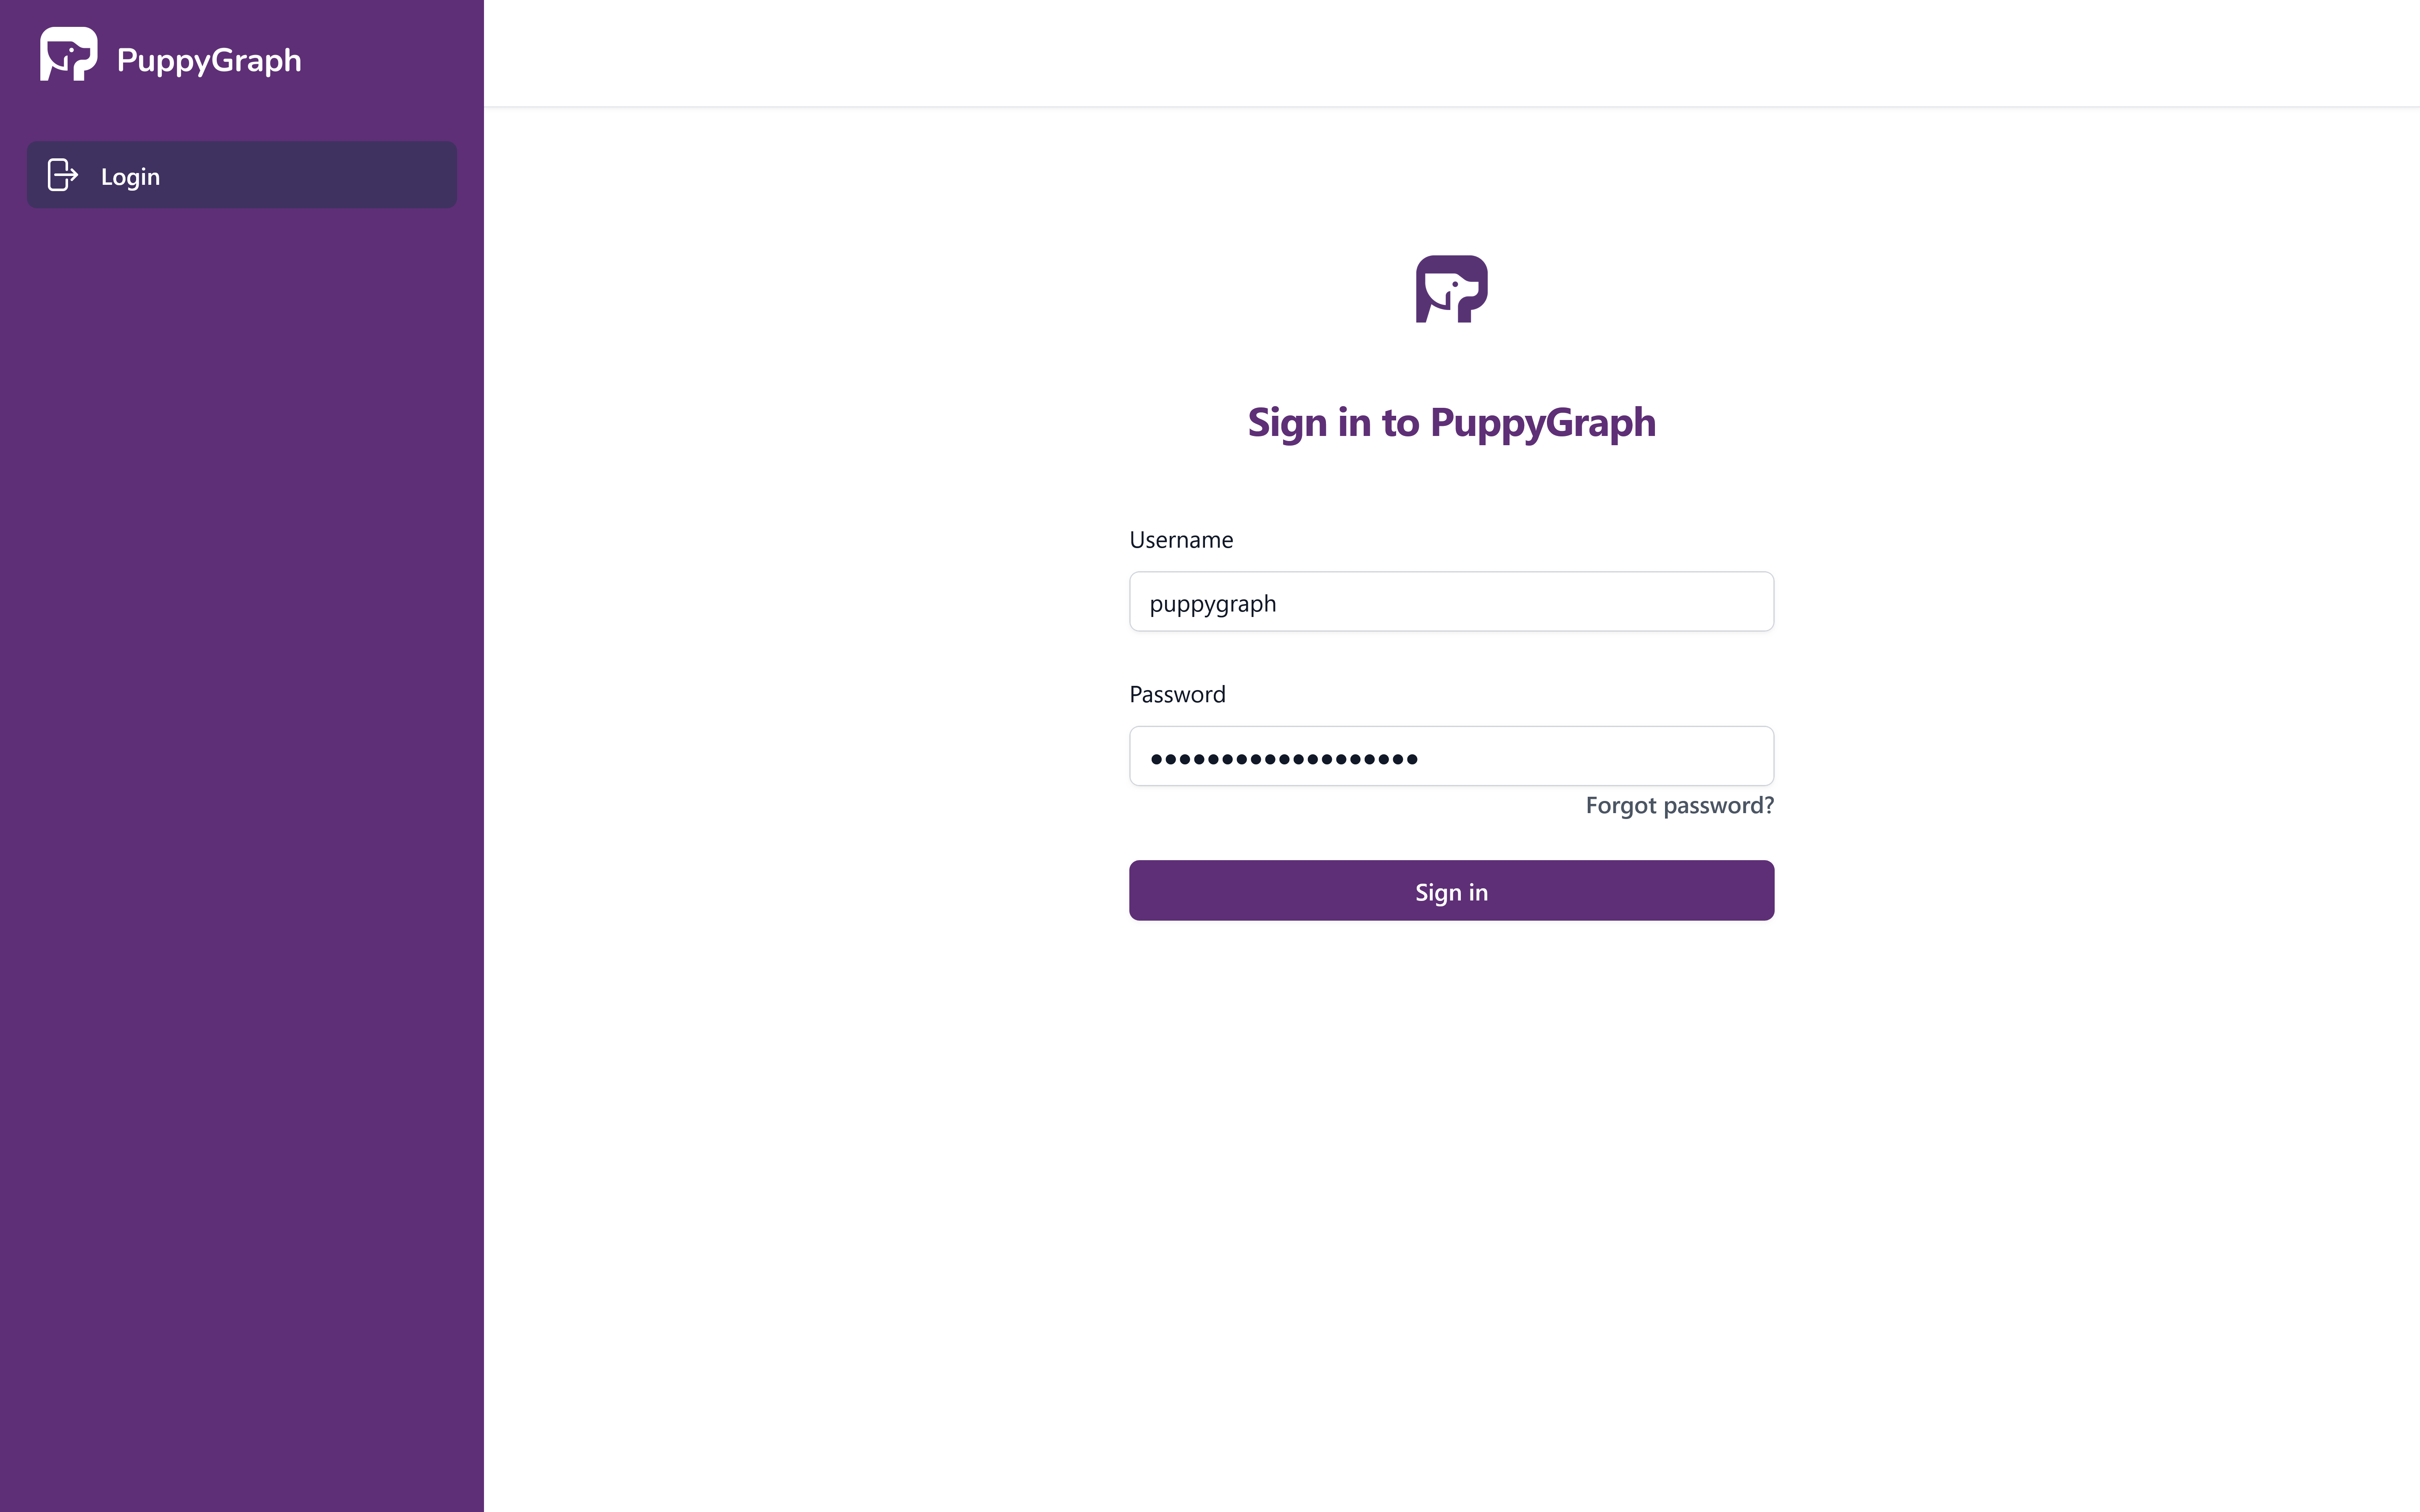
Login
The login page asks for a username and password.
The default username is puppygraph. The default password depends on how the instance was launched:
- The value of the
PUPPYGRAPH_PASSWORDenvironment variable for instances started with Docker. - The EC2 Instance ID for instances launched from the PuppyGraph Professional AMI in AWS Marketplace.
- The Compute Engine Instance ID for instances launched from the PuppyGraph Professional VM in Google Cloud Marketplace.
Left navigation
After signing in, the sidebar exposes the main pages:
| Page | Purpose |
|---|---|
| Graph | Build, view, and edit the graph schema. |
| Catalogs | Manage catalog connections and locally cached tables. |
| Chat | Use the built-in AI chatbot. Appears when AI Chat is enabled. |
| Query | Run Cypher or Gremlin queries against the graph. |
| Dashboard | Customizable tiles for counts, sample data, and saved queries. |
| Cluster | Cluster health and per-node status. |
| Settings | Account preferences, RBAC administration, AI Chat configuration, and server controls. |
| Help | Links to documentation and product help. |
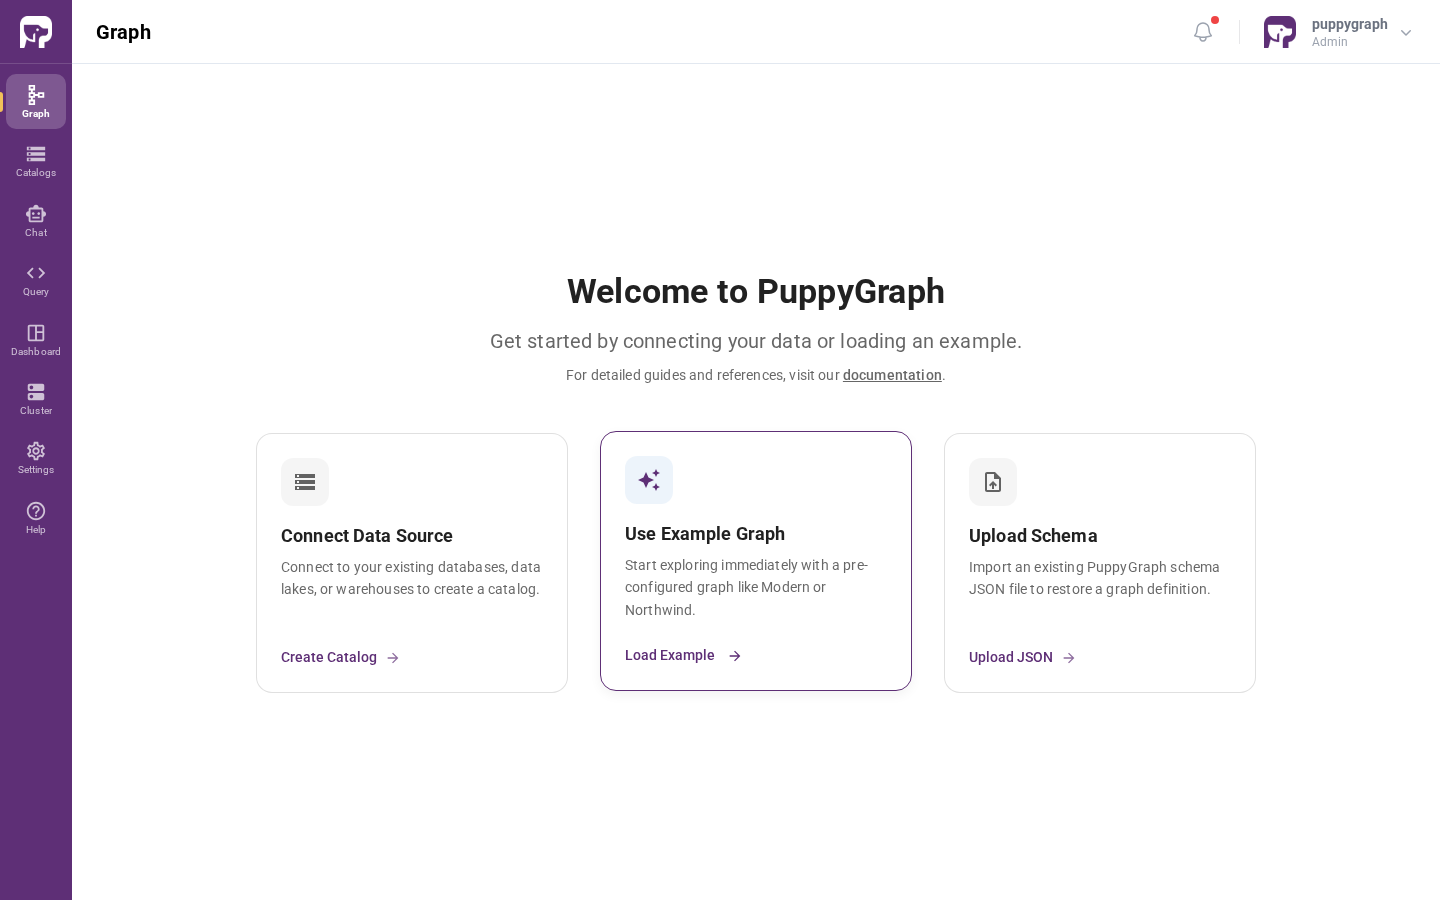
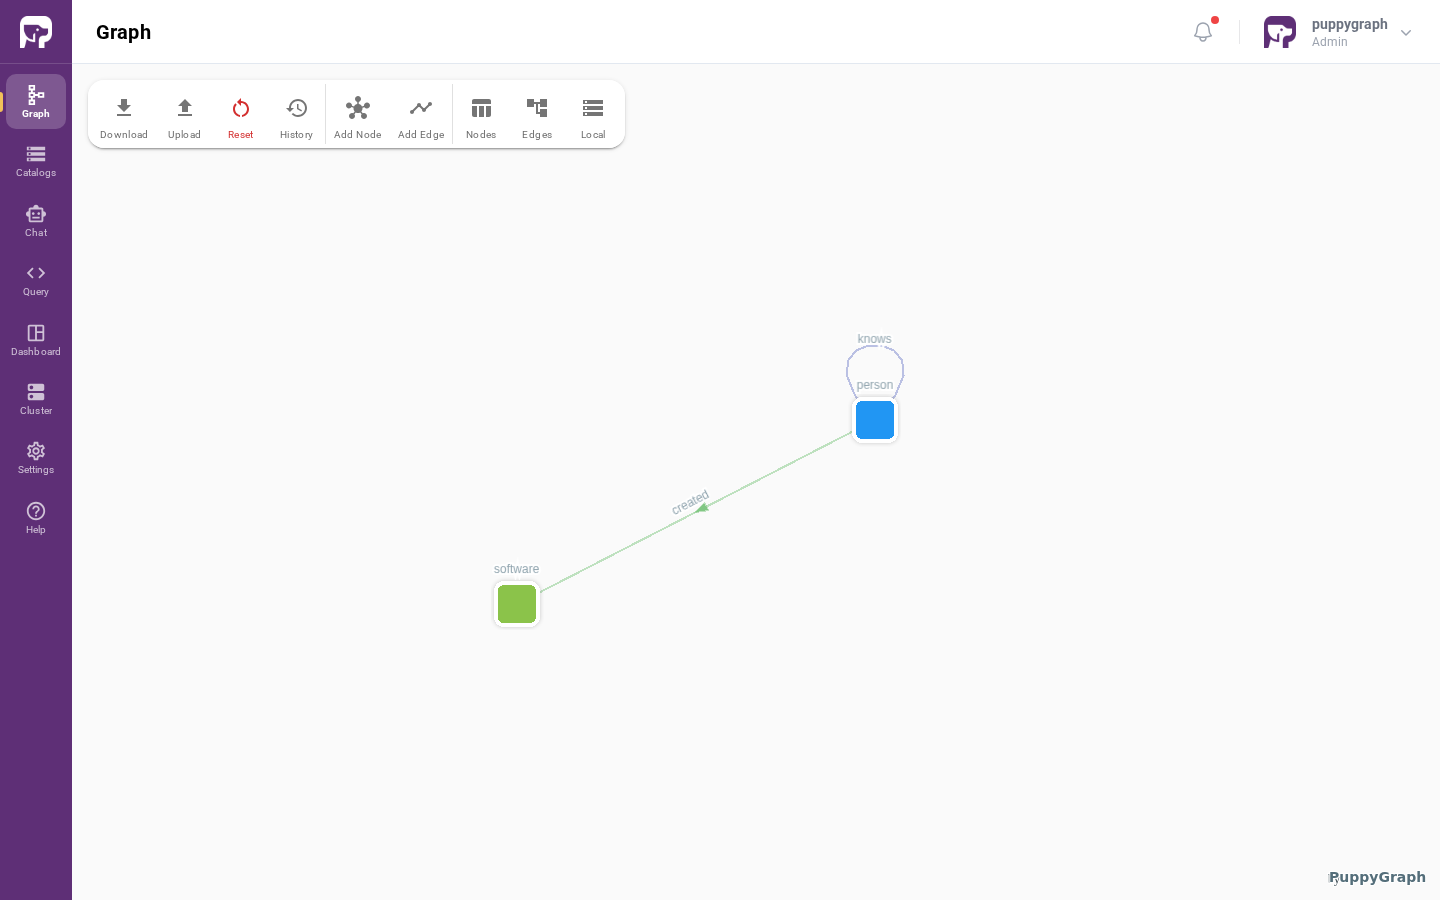
Graph
The Graph page is the home of the Graph Modeling workflow. On a fresh instance, the page shows three quick-start tiles:
- Connect Data Source: open the Schema Builder and add your first catalog.
- Use Example Graph: load the built-in TinkerPop modern graph (or the Northwind graph).
- Upload Schema: upload a v1 schema JSON file directly.
Once a schema is loaded, the page shows the schema canvas with the modeled nodes and edges. The toolbar above the canvas exposes the editing affordances:
- Download and Upload export and import the schema JSON.
- Reset clears the schema.
- History lists prior schema versions.
- Add Node and Add Edge open the Schema Builder wizards.
- Nodes, Edges, and Local filter what the canvas highlights.
For the full Schema Builder walkthrough, see Building a Graph and the Schema Builder tutorial. For uploading and downloading the schema JSON, see Managing the Graph.
Catalogs
The Catalogs page lists every catalog connection on the instance and lets you inspect and manage them.
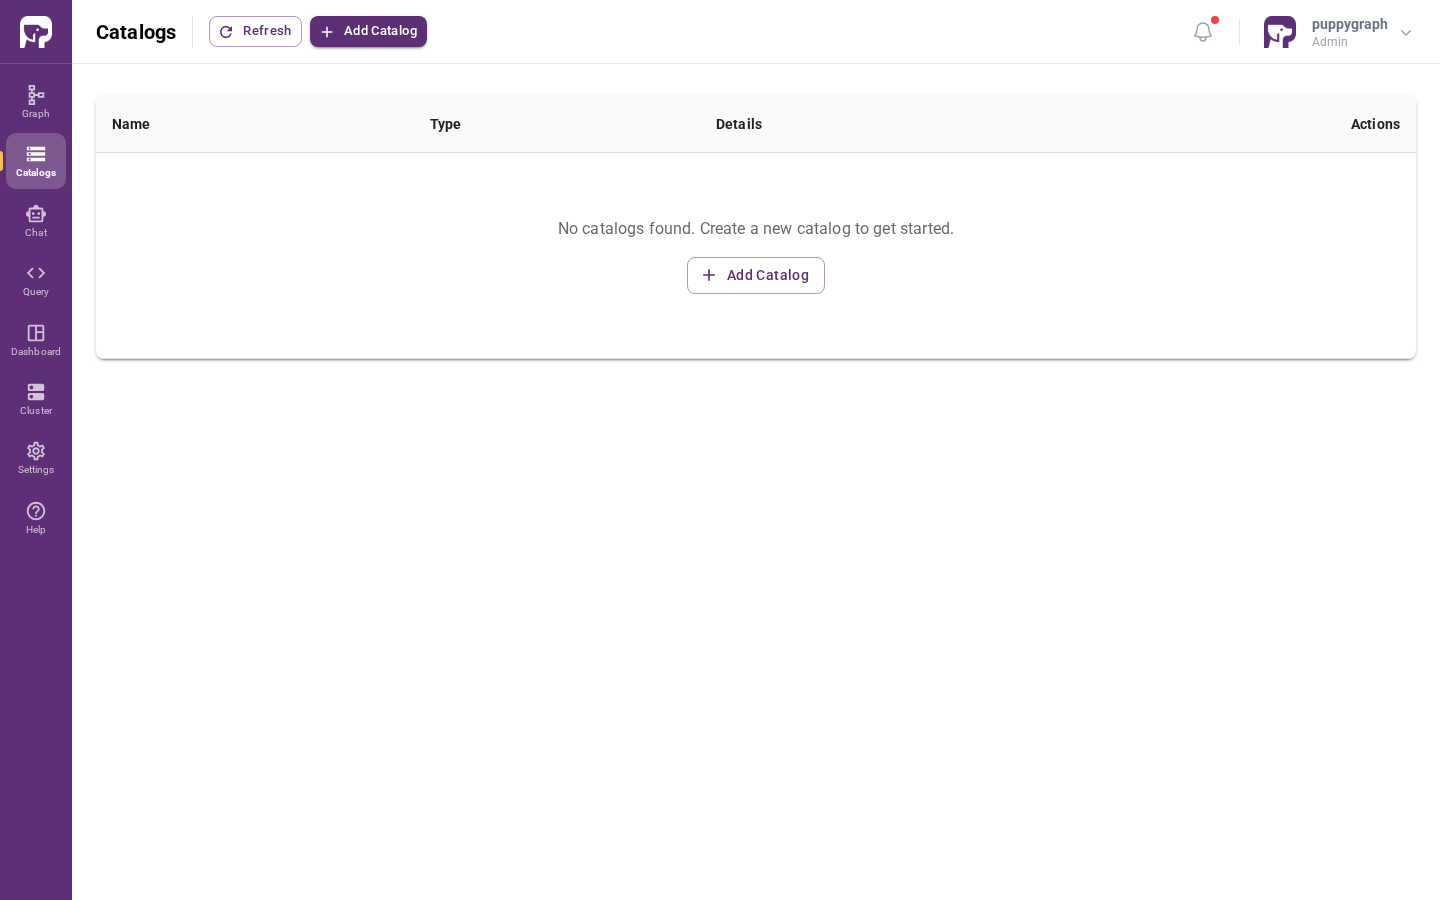
From this page you can:
- Add a new catalog connection (
Add Catalog) without leaving the page. - Refresh the list and the underlying database / table metadata.
- For an existing catalog, drill into its databases and tables.
- Manage locally cached tables (status, refresh, partition details, source info, import history).
See Data Sources and Local Tables for the underlying configuration.
Chat
The Chat page contains PuppyGraph's built-in AI chatbot. It appears in the left navigation when AI Chat is enabled.
Use Chat to:
- Ask PuppyGraph to inspect connected catalogs and build a graph schema.
- Generate and run graph queries from natural-language questions.
- Explain query results using the active graph schema as context.
For setup, usage patterns, and operational guidance, see Built-in AI Chatbot. For a complete schema-building walkthrough, see Building a Graph with the AI Assistant.
Query
The Query page is a single editor panel that runs Cypher or Gremlin queries against the current graph. The language is toggled from the toolbar (the Cypher button cycles between Cypher and Gremlin), and the timeout is configured next to it.
Below the editor are tabbed result views (Graph, Table, Schema, Raw) and a history panel of prior runs.
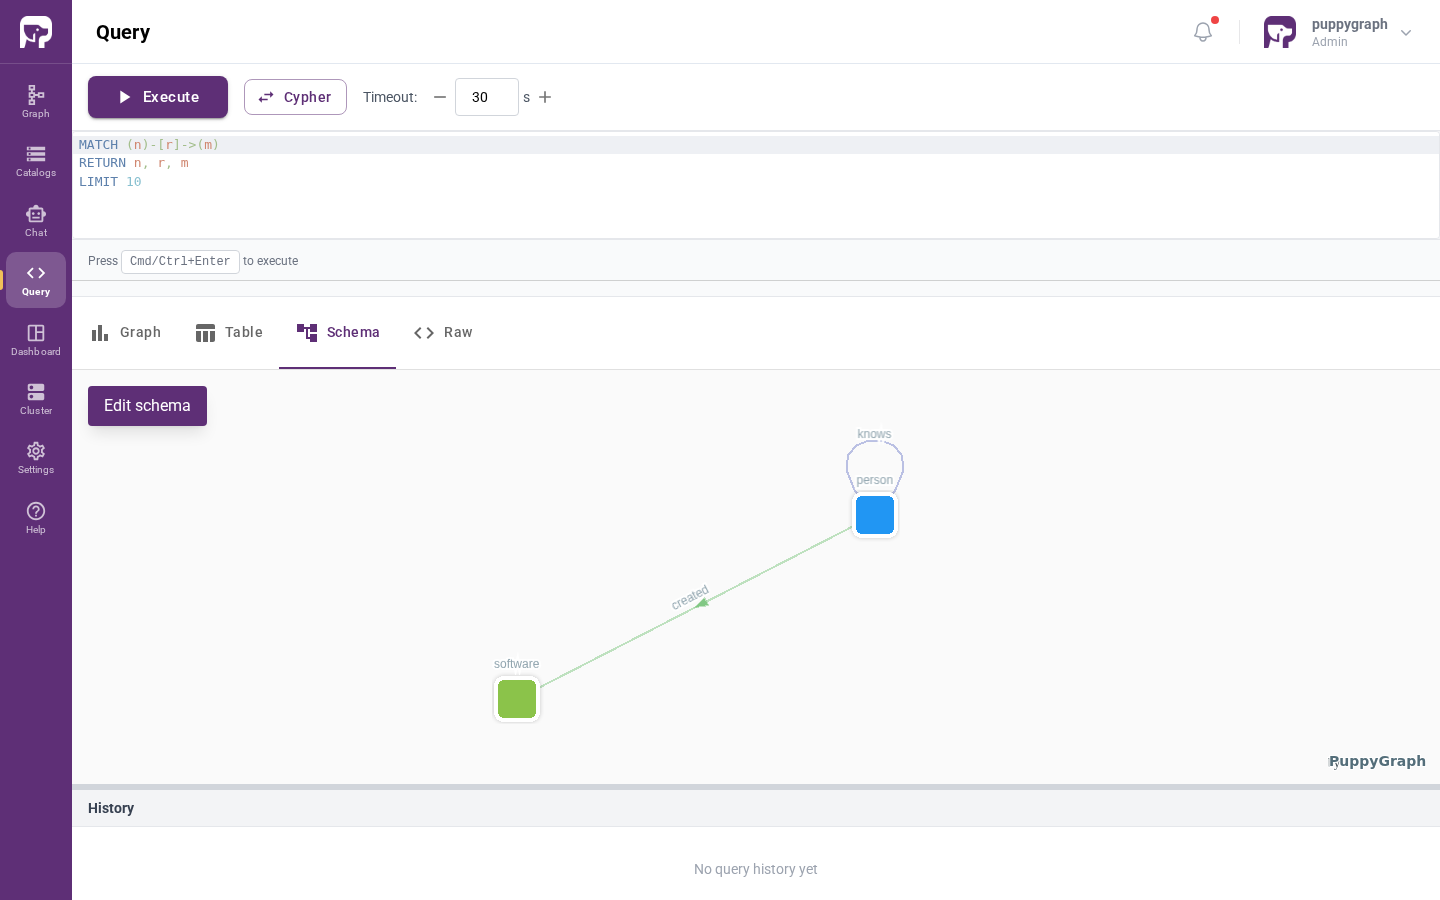
See Querying for query-language details. The result panel's Graph tab handles the visualization; the Dashboard page is the place to assemble persistent saved views.
Dashboard
The Dashboard page is a customizable grid of tiles for sharing high-level views of the graph: counts of nodes / edges by label, sample rows, embedded query results, and a graph-samples panel.
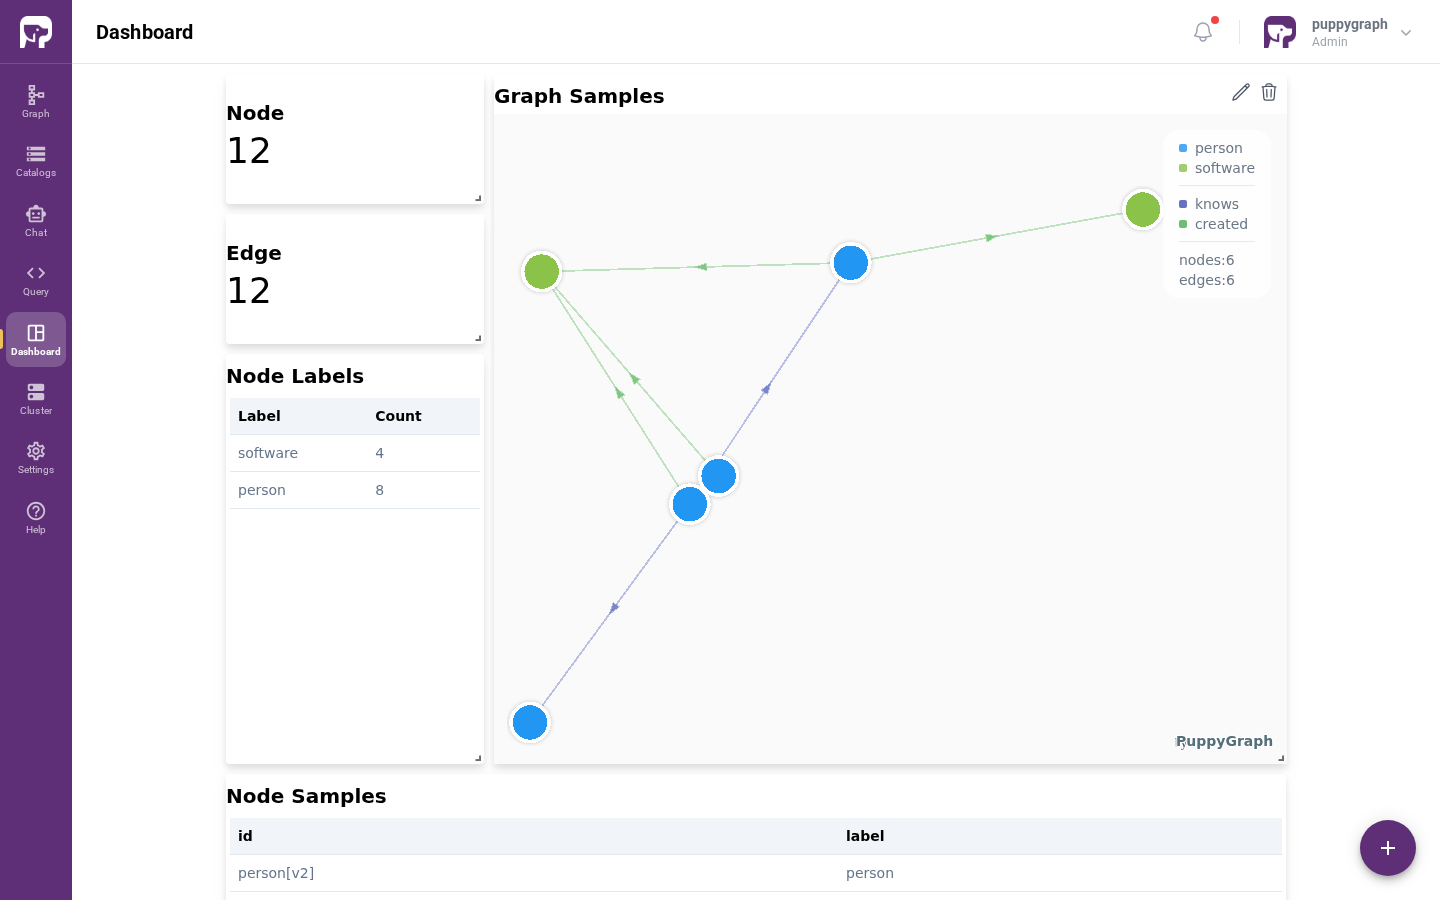
See Dashboard for details.
Cluster
The Cluster page shows the cluster topology as two sections of node cards. The header shows the overall cluster status and the active schema version.
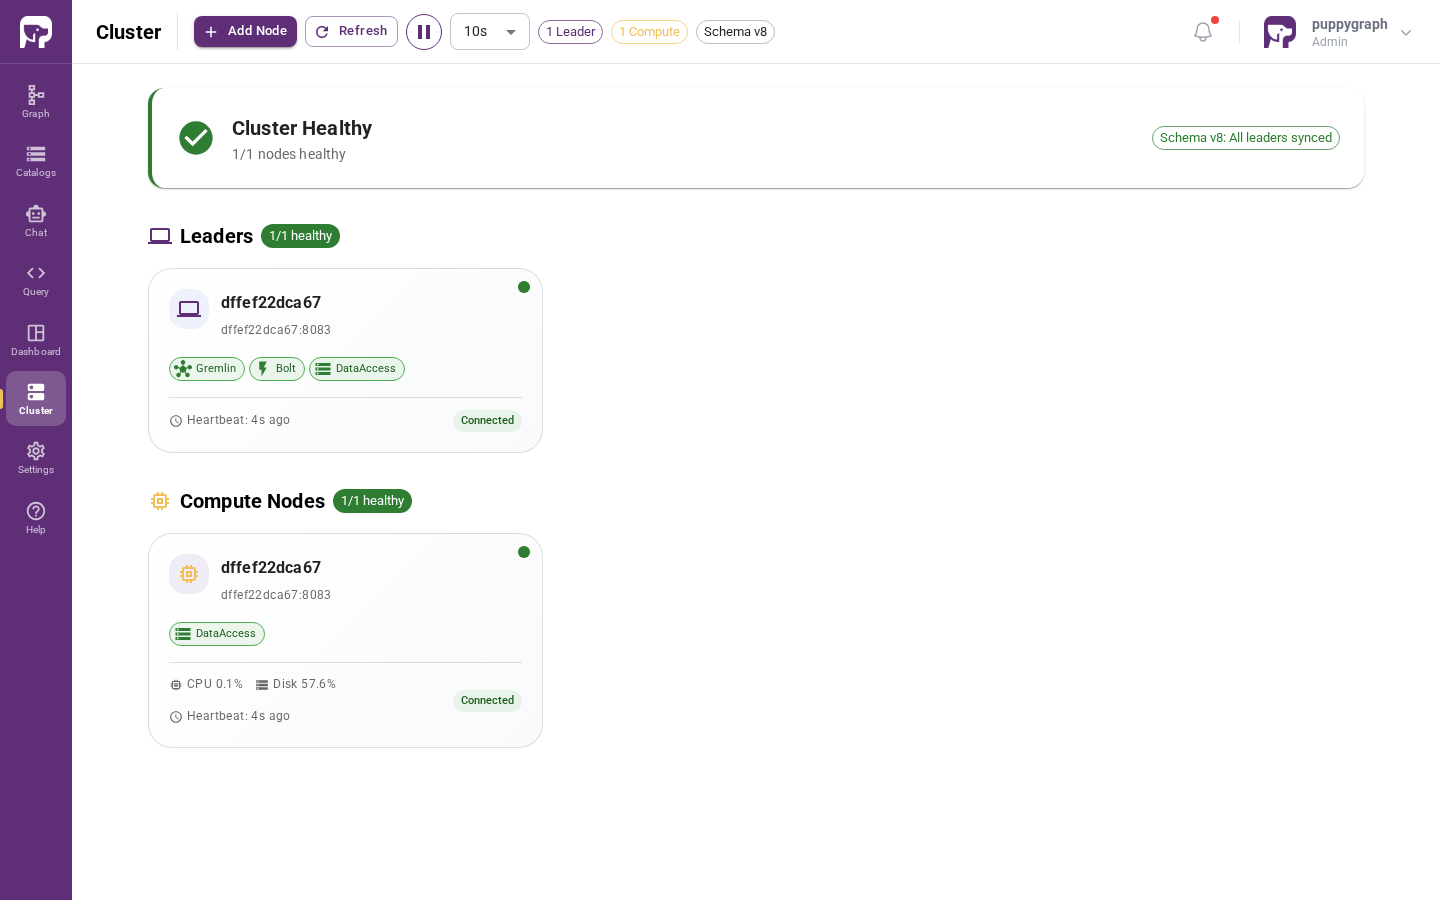
Each Leader card shows the node's address, role in the quorum, and service health.
Each Compute card shows the node's address, service health, and current resource usage.
For how to deploy a PuppyGraph cluster and manage its nodes, see Cluster Deployment.
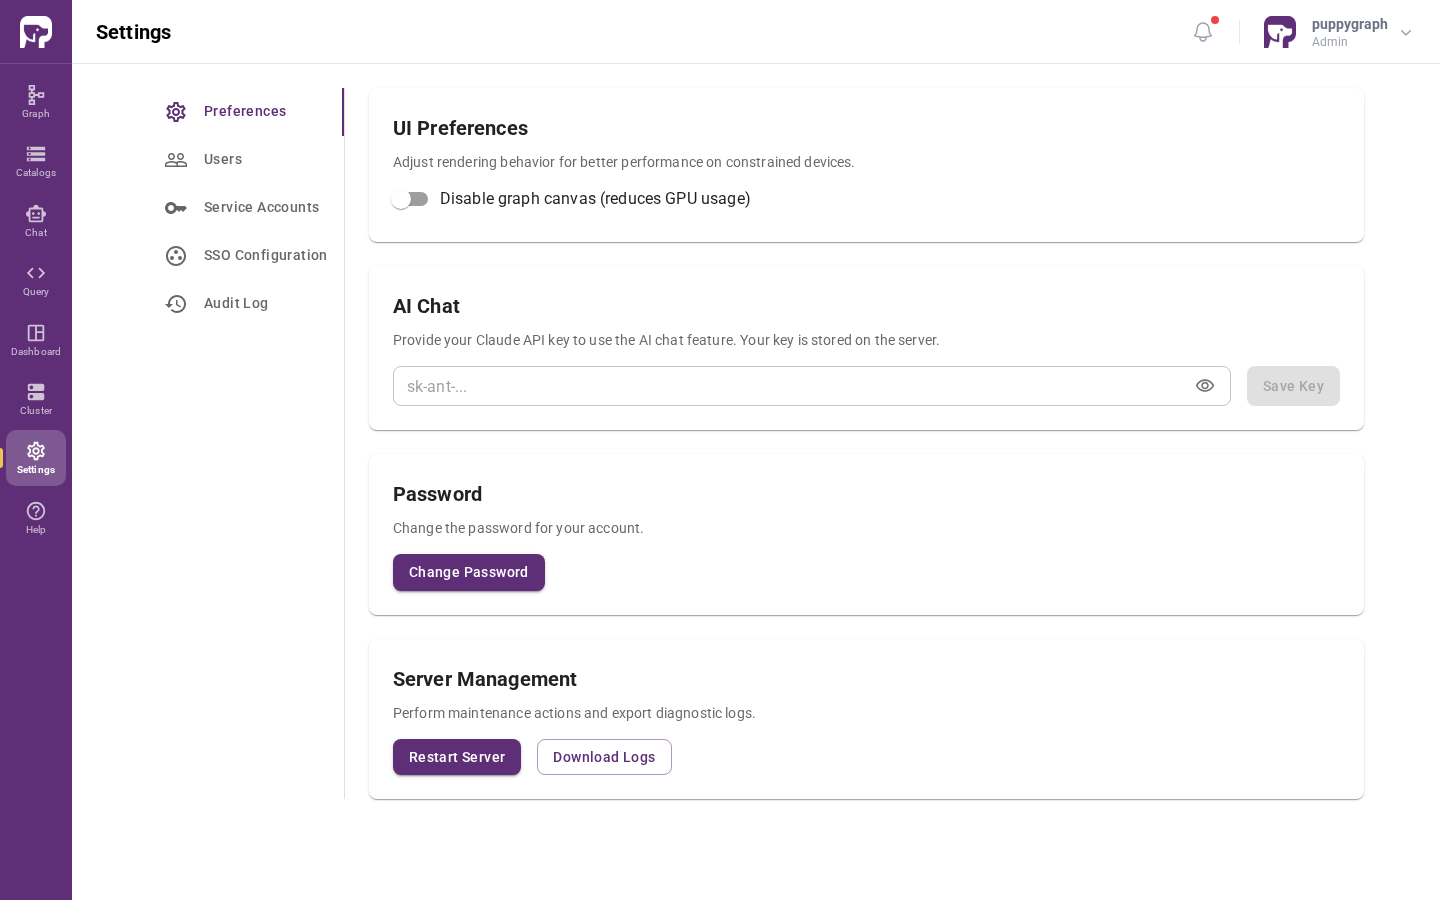
Settings
The Settings page is organized as tabs:
| Tab | Purpose |
|---|---|
| Preferences | UI Preferences (e.g. disabling the graph-canvas render to reduce GPU usage), the AI Chat API key, password change, and server management (restart, download logs). |
| Users | Local user accounts and role assignments. Available when RBAC is enabled. |
| Service Accounts | Programmatic API credentials. Available when RBAC is enabled. |
| SSO Configuration | Configure SSO providers (OIDC, SAML). Available when RBAC is enabled. |
| Audit Log | View administrative actions. Available when RBAC is enabled. |