Querying ClickHouse Data as a Graph
Available since
ClickHouse connection is available since version 0.73
Summary
In this tutorial, you will:
- Create a ClickHouse database and load it with example data;
- Start a PuppyGraph Docker container and query the ClickHouse data as a graph.
Prerequisites
Please ensure that docker compose is available. The installation can be verified by running:
See https://docs.docker.com/compose/install/ for Docker Compose installation instructions and https://www.docker.com/get-started/ for more details on Docker.
Accessing the PuppyGraph Web UI requires a browser. However, the tutorial offers alternative instructions for those who wish to exclusively use the CLI.
Deployment
 Create a file
 docker-compose.yaml with the following content:
docker-compose.yaml
version: "3"

services:
  puppygraph:
    image: puppygraph/puppygraph:0.73
    pull_policy: always
    container_name: puppygraph
    environment:
      - PUPPYGRAPH_USERNAME=puppygraph
      - PUPPYGRAPH_PASSWORD=puppygraph123
    networks:
      ch_net:
    ports:
      - "8081:8081"
      - "8182:8182"
      - "7687:7687"
  clickhouse-server:
    image: clickhouse/clickhouse-server:latest
    container_name: clickhouse-server
    environment:
      - CLICKHOUSE_USER=ch_user
      - CLICKHOUSE_PASSWORD=ch_pwd
    networks:
      - ch_net
    ports:
      - "8123:8123"
      - "9000:9000"
      - "9004:9004"
networks:
  ch_net:
    name: puppy-ch
Update password
Ensure to modify your password environment variables, particularly when your machine is publicly accessible.
Then run the following command to start ClickHouse and PuppyGraph:
[+] Running 3/3
 ✔ Network puppy-ch             Created
 ✔ Container clickhouse-server  Started
 ✔ Container puppygraph         Started
Data Preparation
This tutorial is designed to be comprehensive and standalone, so it includes steps to populate data in ClickHouse. In practical scenarios, PuppyGraph can query data directly from your existing ClickHouse databases.
Run the following command to start a ClickHouse shell to access the database:
The shell will be as follows:
ClickHouse client version 25.4.2.31 (official build).
Connecting to localhost:9000 as user ch_user.
Connected to ClickHouse server version 25.4.2.

Warnings:
 * Delay accounting is not enabled, OSIOWaitMicroseconds will not be gathered. You can enable it using `echo 1 > /proc/sys/kernel/task_delayacct` or by using sysctl.

45beff86ac12 :)
Then execute the following SQL statements in the shell to create tables and insert data.
CREATE DATABASE IF NOT EXISTS modern;
USE modern;

CREATE TABLE modern.person
(
    id   String,
    name String,
    age  Int32
) ENGINE = MergeTree()
ORDER BY id;

INSERT INTO modern.person (id, name, age) VALUES
    ('v1','marko',29),
    ('v2','vadas',27),
    ('v4','josh',32),
    ('v6','peter',35);

CREATE TABLE modern.software
(
    id   String,
    name String,
    lang String
) ENGINE = MergeTree()
ORDER BY id;

INSERT INTO modern.software (id, name, lang) VALUES
    ('v3','lop','java'),
    ('v5','ripple','java');

CREATE TABLE modern.created
(
    id      String,
    from_id String,
    to_id   String,
    weight  Float64
) ENGINE = MergeTree()
ORDER BY id;

INSERT INTO modern.created (id, from_id, to_id, weight) VALUES
    ('e9','v1','v3',0.4),
    ('e10','v4','v5',1.0),
    ('e11','v4','v3',0.4),
    ('e12','v6','v3',0.2);

CREATE TABLE modern.knows
(
    id      String,
    from_id String,
    to_id   String,
    weight  Float64
) ENGINE = MergeTree()
ORDER BY id;

INSERT INTO modern.knows (id, from_id, to_id, weight) VALUES
    ('e7','v1','v2',0.5),
    ('e8','v1','v4',1.0);
The above SQL creates the following tables:
| id | name | age |
|---|---|---|
| v1 | marko | 29 |
| v2 | vadas | 27 |
| v4 | josh | 32 |
| v6 | peter | 35 |
| id | name | lang |
|---|---|---|
| v3 | lop | java |
| v5 | ripple | java |
| id | from_id | to_id | weight |
|---|---|---|---|
| e7 | v1 | v2 | 0.5 |
| e8 | v1 | v4 | 1.0 |
| id | from_id | to_id | weight |
|---|---|---|---|
| e9 | v1 | v3 | 0.4 |
| e10 | v4 | v5 | 1.0 |
| e11 | v4 | v3 | 0.4 |
| e12 | v6 | v3 | 0.2 |
We then define a graph on top of the data tables we just created. Actually, this is the "Modern" graph defined by Apache Tinkerpop.
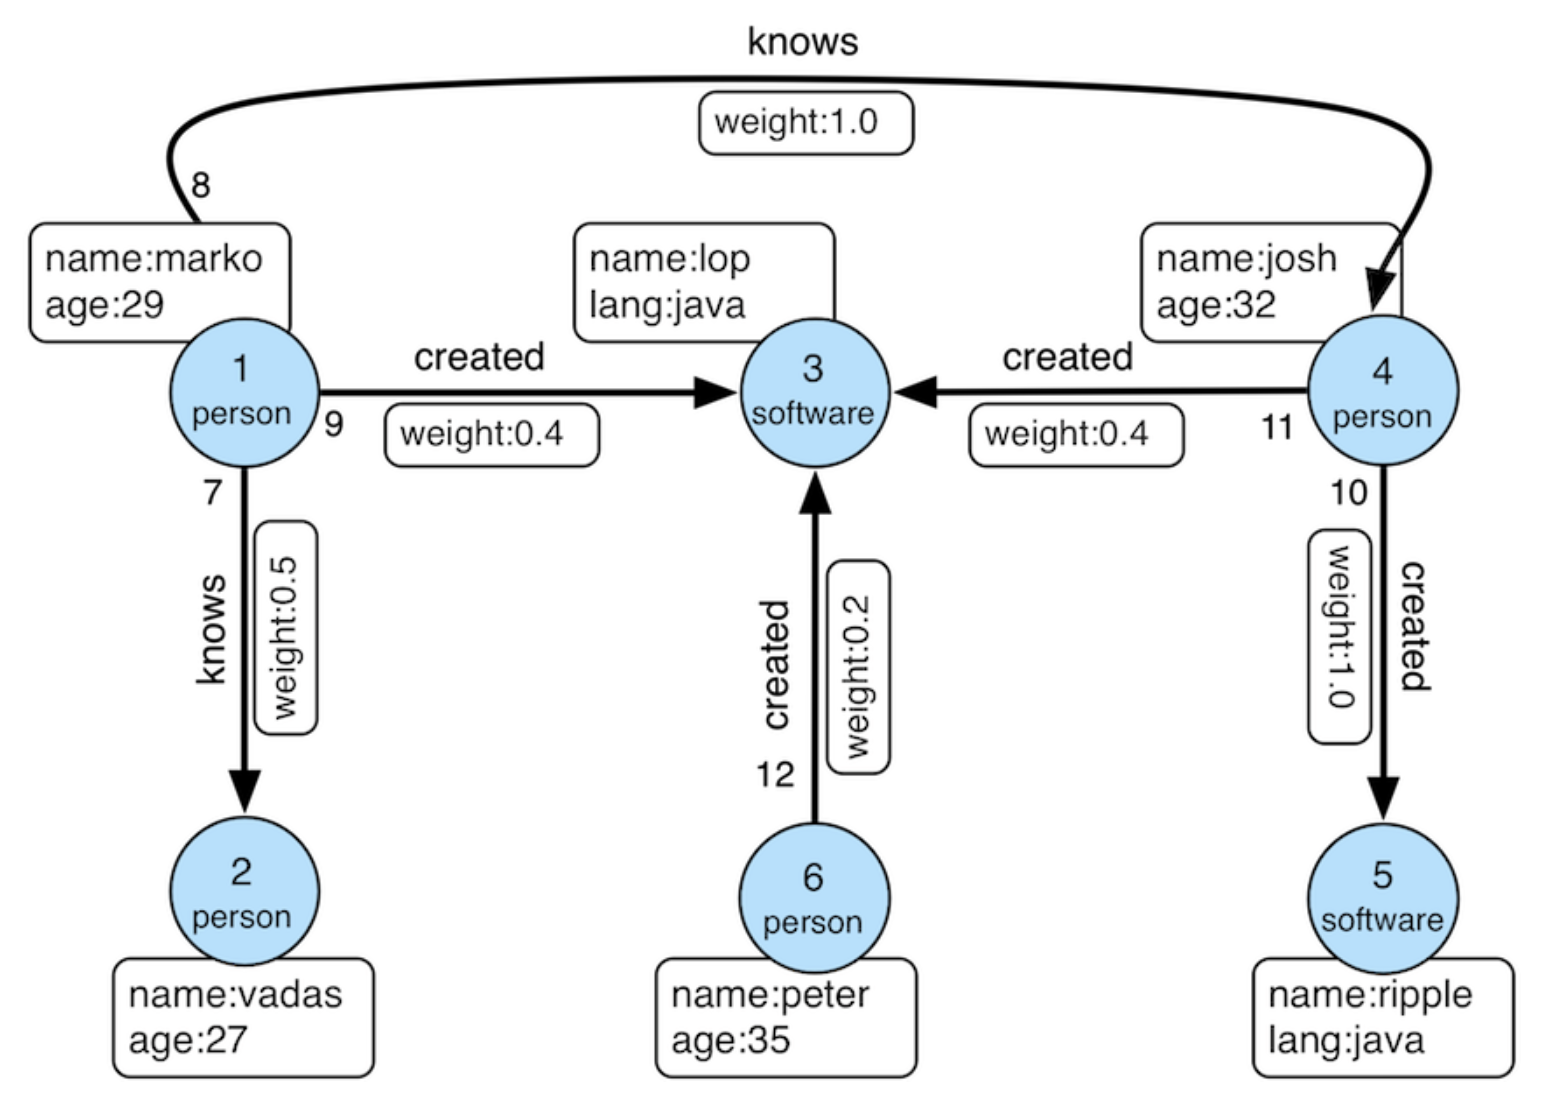
Modern Graph
Modeling a Graph
Step 1: Connecting to ClickHouse Server
Log in to PuppyGraph with puppygraph as the username and puppygraph123 as the password.
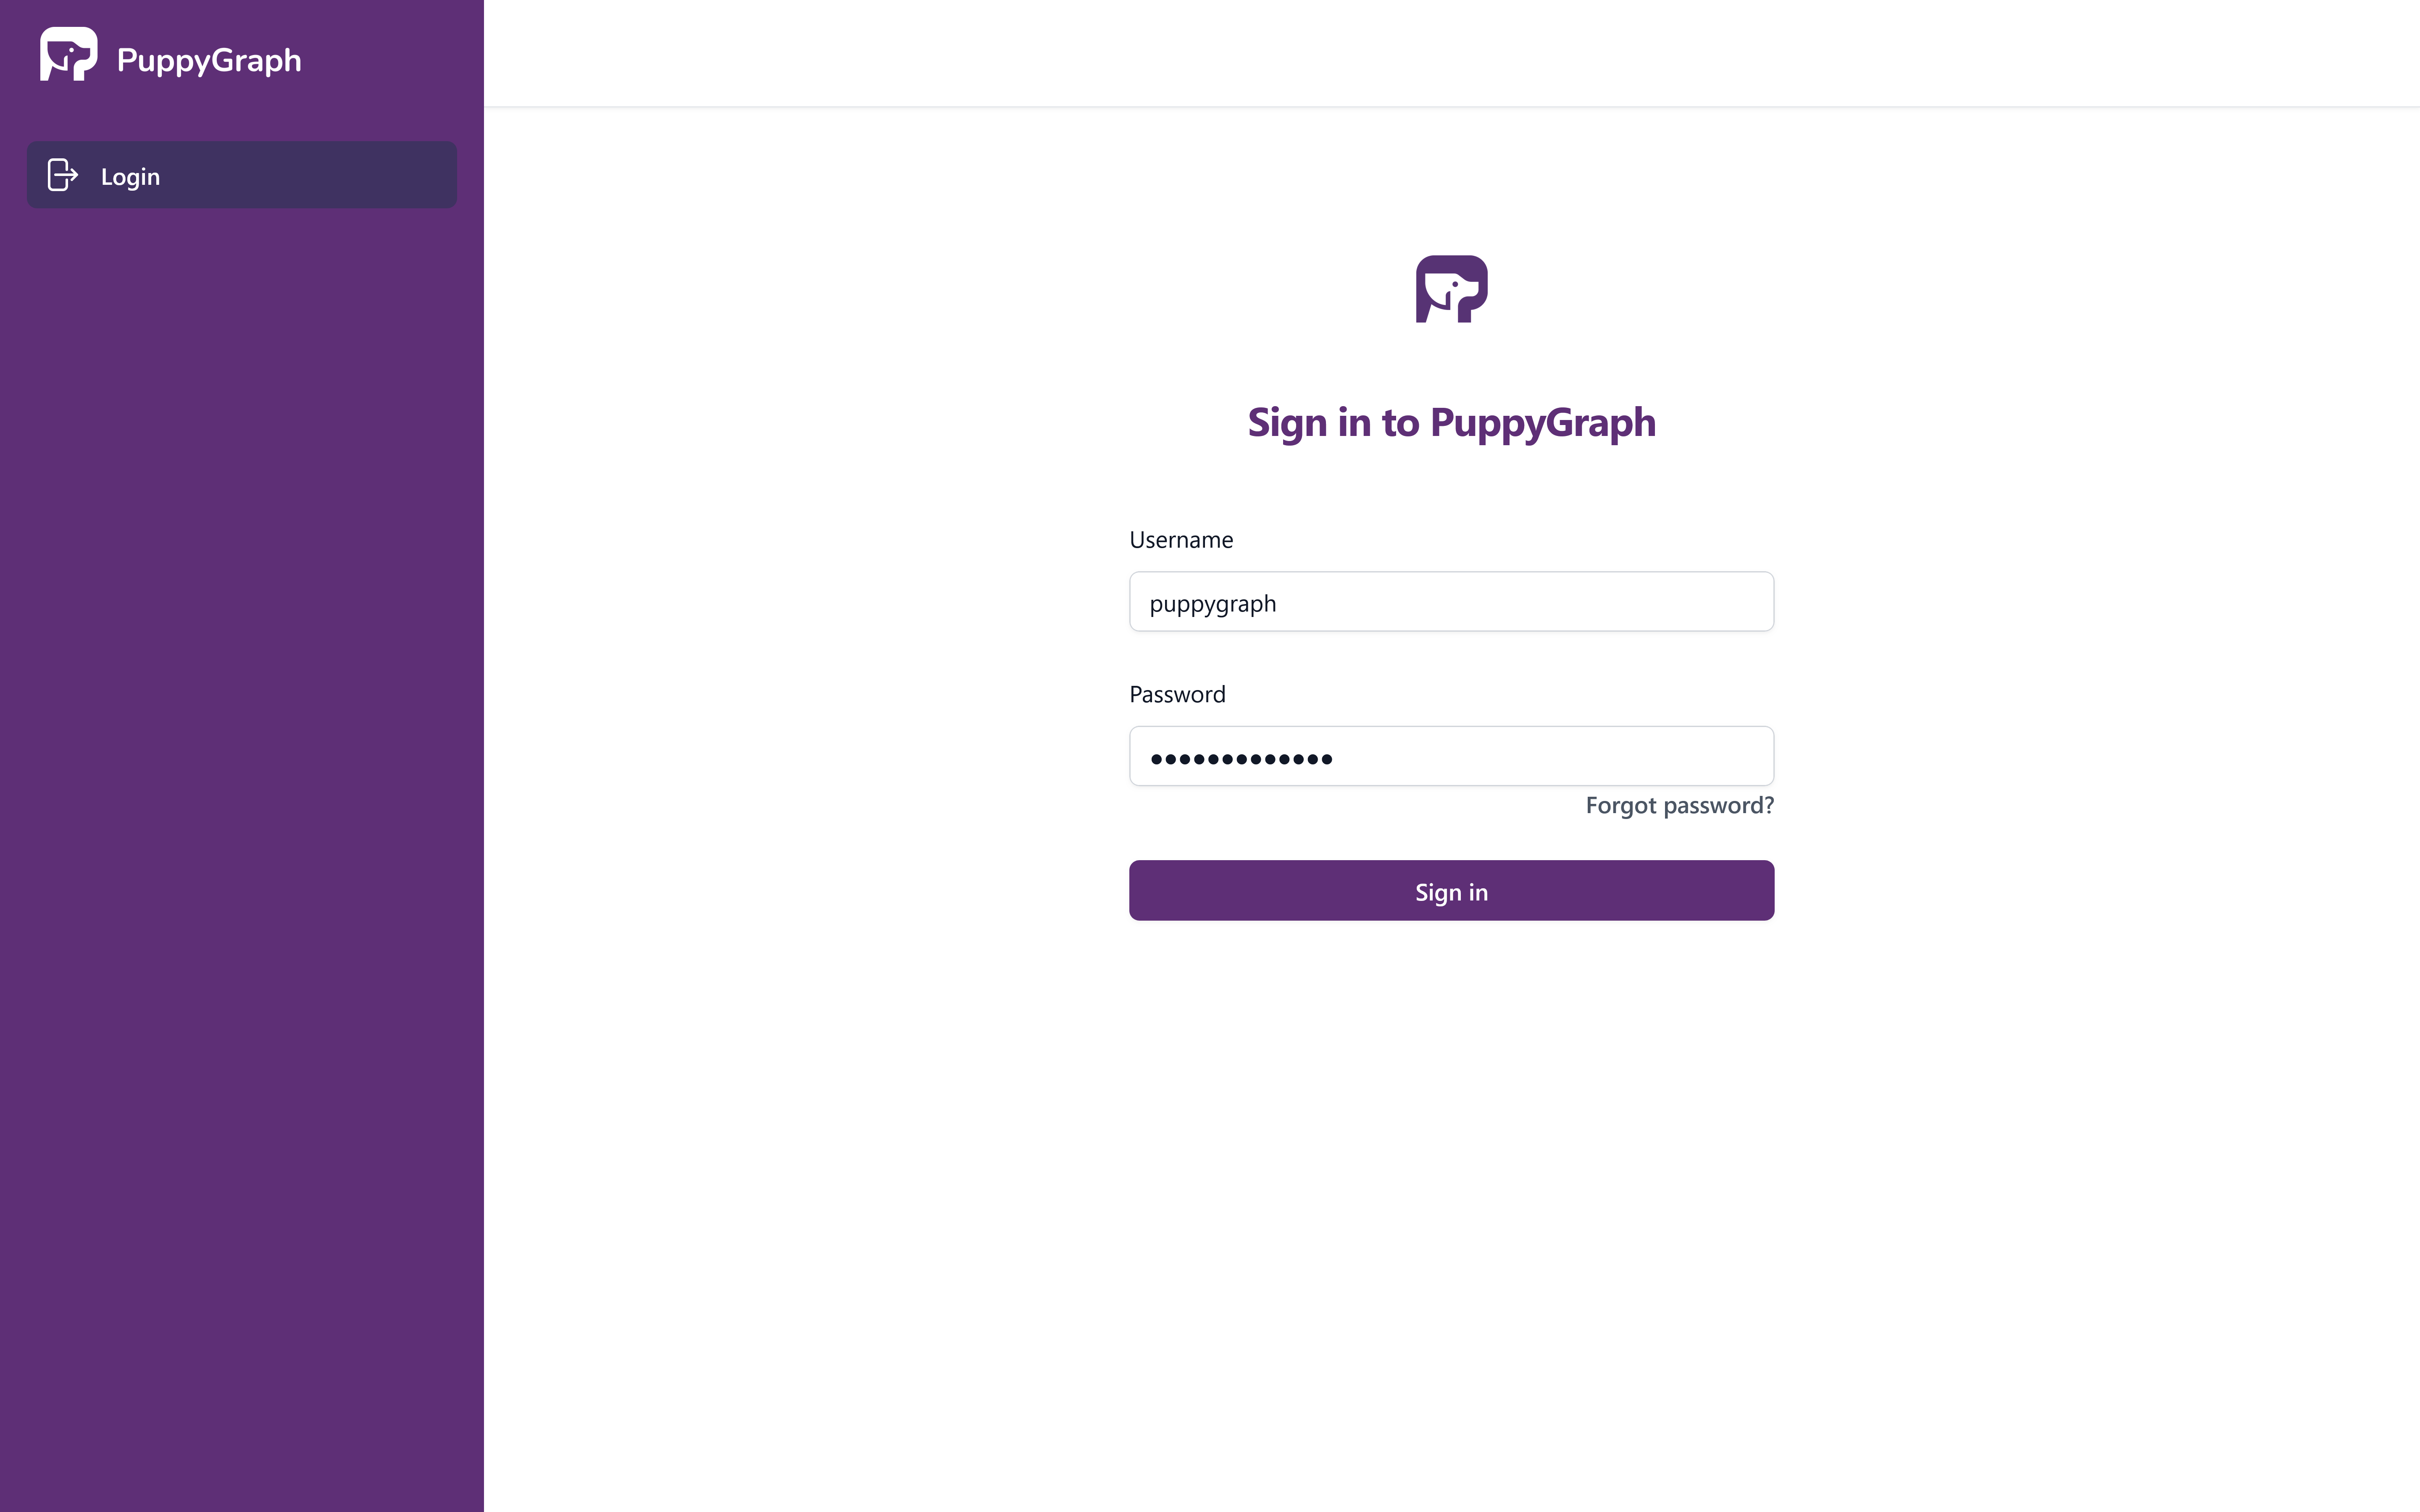
PuppyGraph Login
Click on Create graph schema to create a new graph schema.
Fill in the fields as follows.
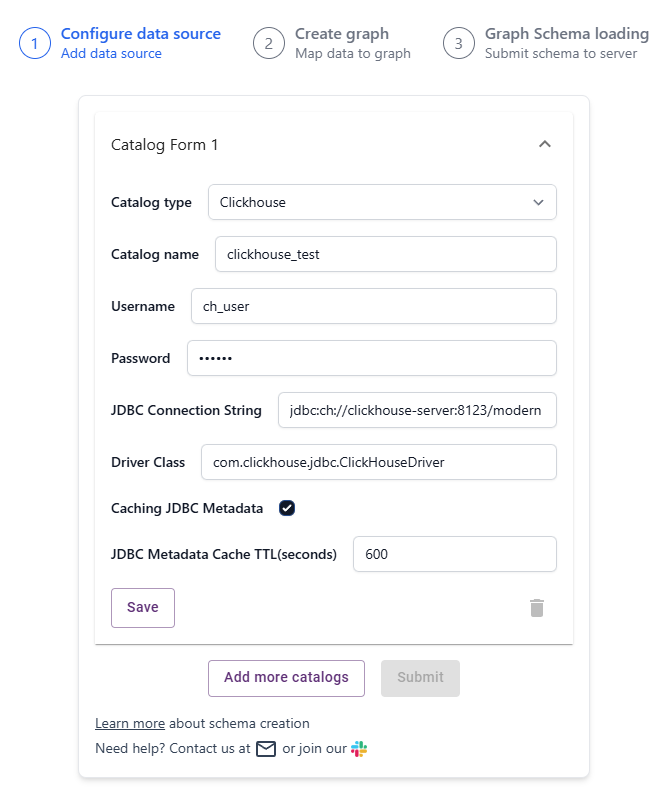
Create ClickHouse Catalog
| Parameter | Value |
|---|---|
| Catalog type | Clickhouse |
| Catalog name | Some name for the catalog as you like. |
| Username | Same as CLICKHOUSE_USER in docker-compose.yaml |
| Password | Same as CLICKHOUSE_PASSWORD in docker-compose.yaml |
| JDBC Connection String | jdbc:ch://<host>:<port>/<database> |
| Driver Class | The class name of the JDBC Driver. The default value is com.clickhouse.jdbc.ClickHouseDriver, and typically you don’t need to change it. |
Click on Save, then Click on Submit to connect to ClickHouse Server.
Step 2: Building the Graph Schema
In the Schema Builder, add the first node (vertex) to the graph from the table person.
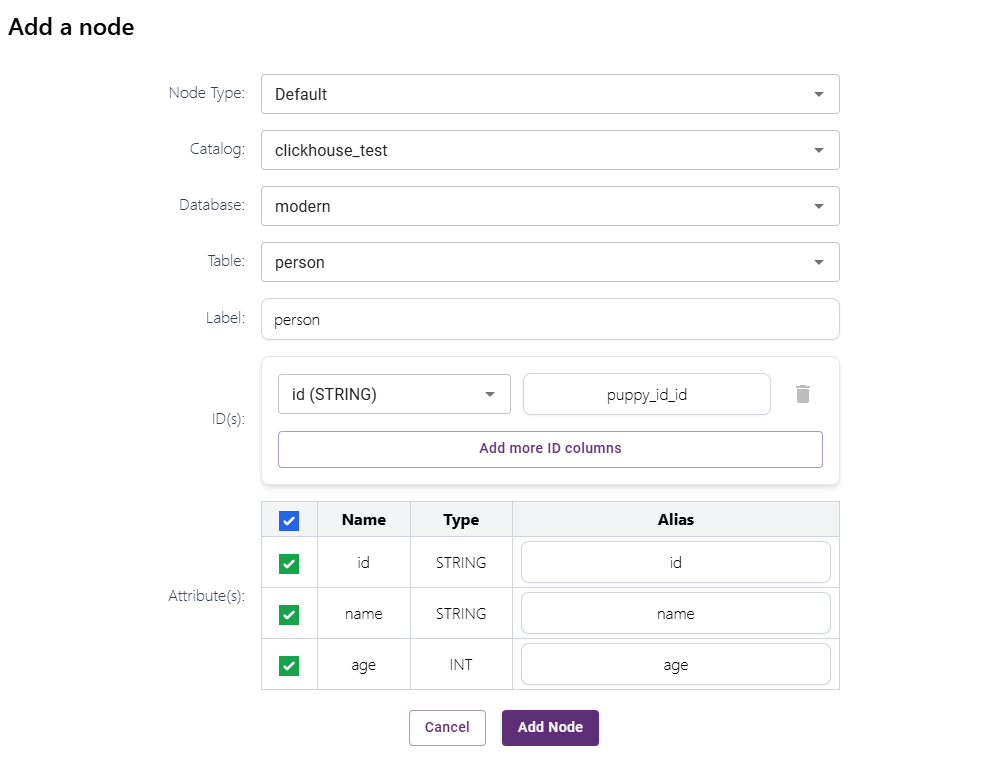
After that use the Auto Suggestion to create other nodes and edges.
Select person as the start node (vertex) and add the auto suggested nodes and edges.
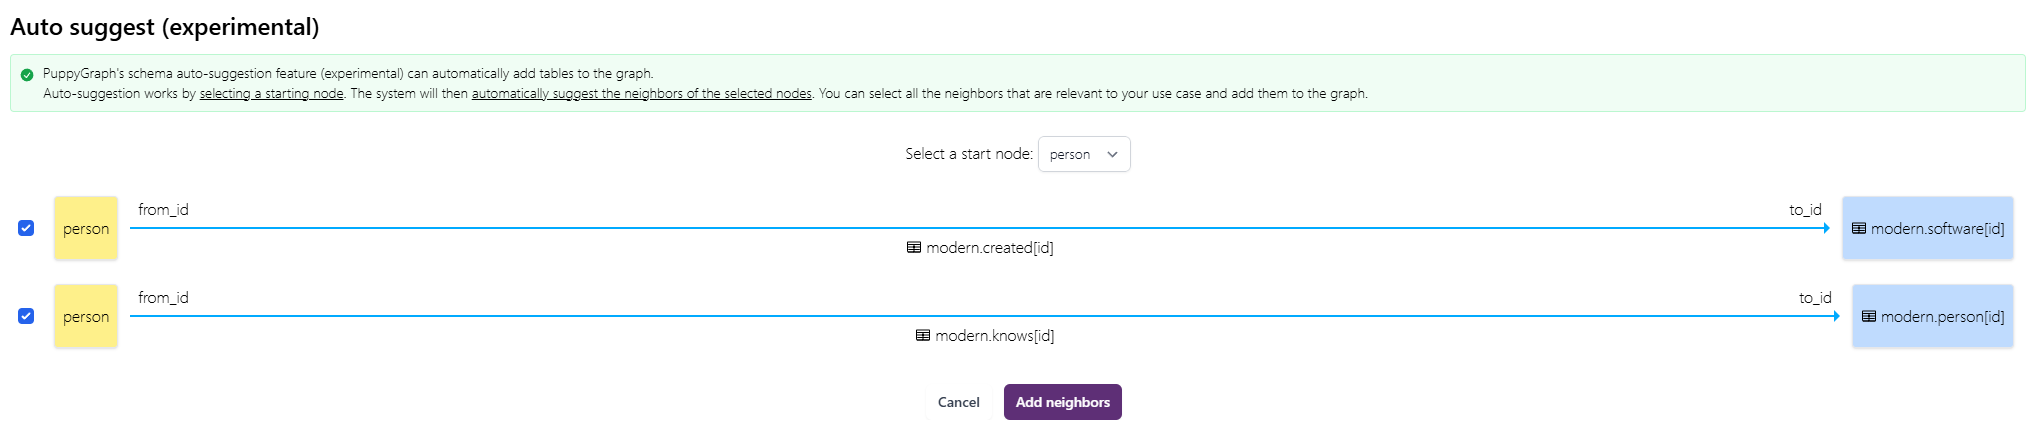
The graph schema should look like this:
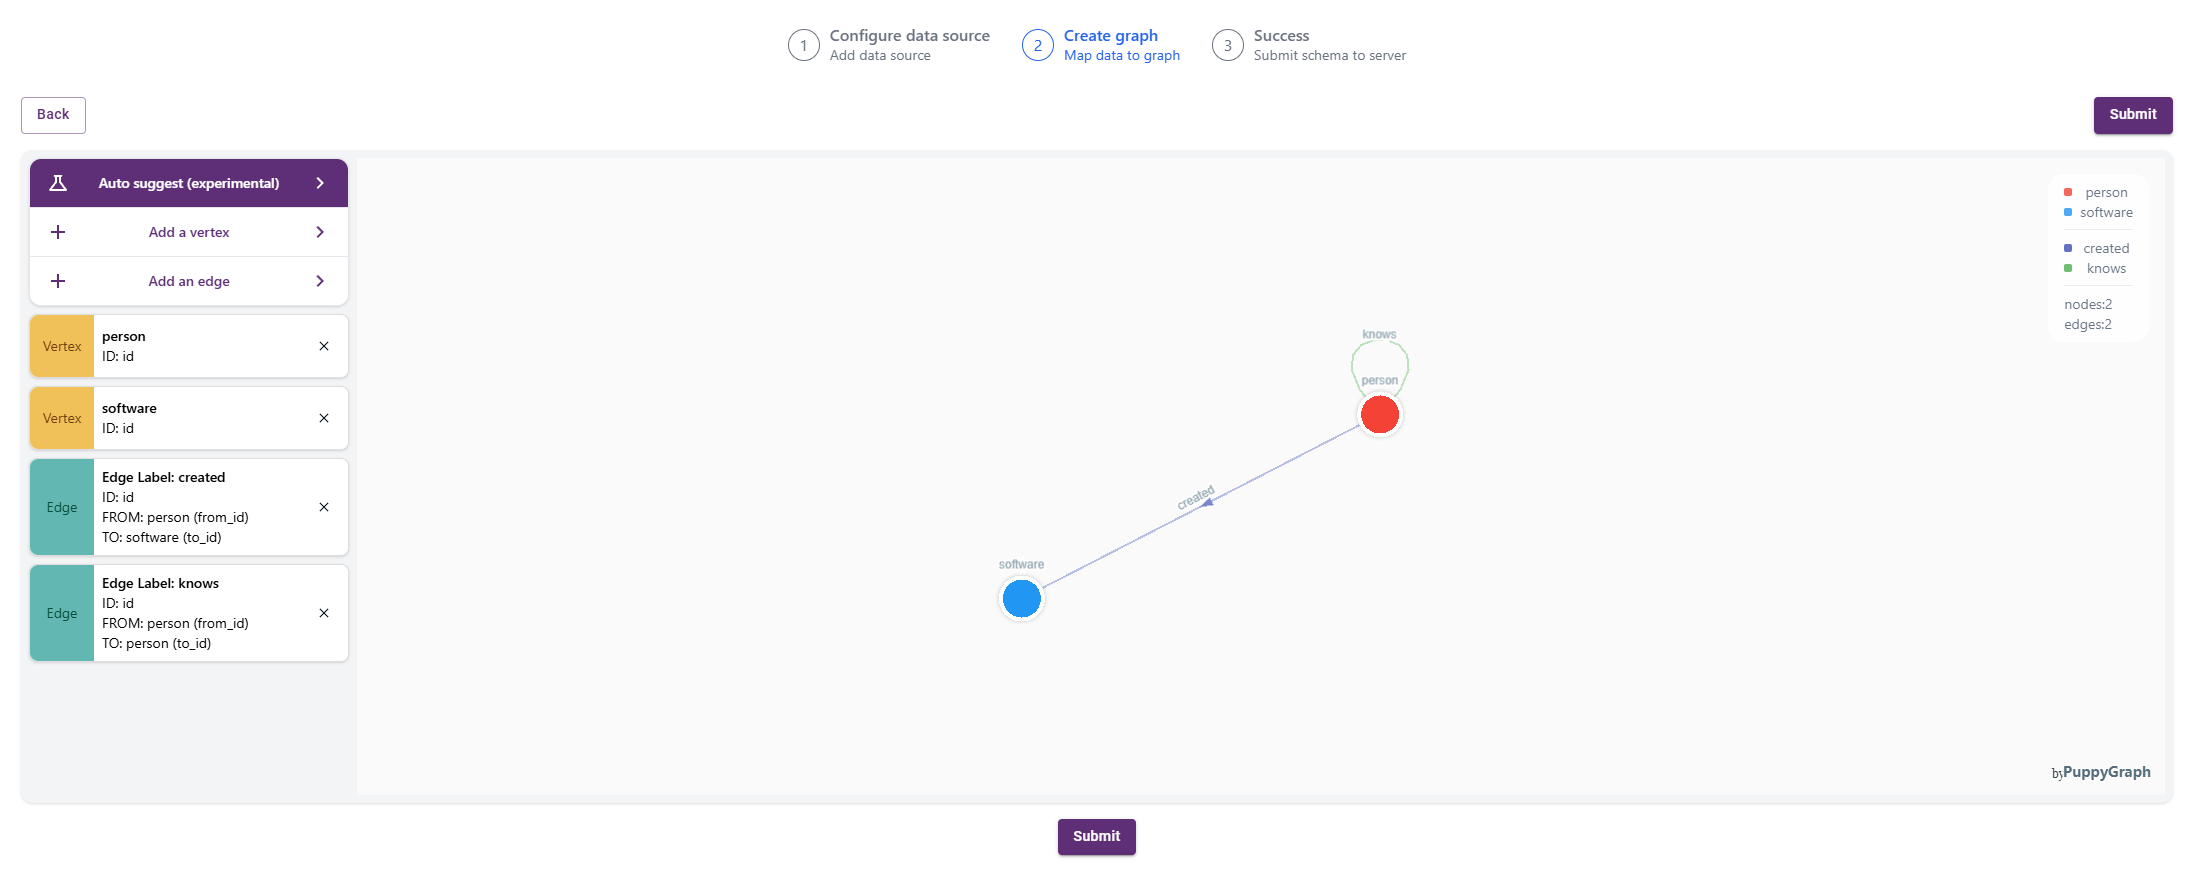 Submit the schema to create the graph.
Step 3: Querying the Graph
PuppyGraph provides a Dashboard that gives the summary of the graph.

Use the Interactive Query UI to further explore the graph by sending queries.
Querying the Graph
In this tutorial, we will use the Gremlin and Cypher query languages to interact with the Graph. Gremlin, developed by Apache TinkerPop, and Cypher, designed by Neo4j, are both powerful graph query languages. Prior knowledge of either Gremlin or Cypher is not necessary to follow this tutorial. To learn more about Gremlin, visit https://tinkerpop.apache.org/gremlin.html. For information on Cypher, you can check out https://neo4j.com/product/cypher-graph-query-language/.
Click on the Query panel the left side. The Gremlin Query tab offers an interactive environment for querying the graph using Gremlin.
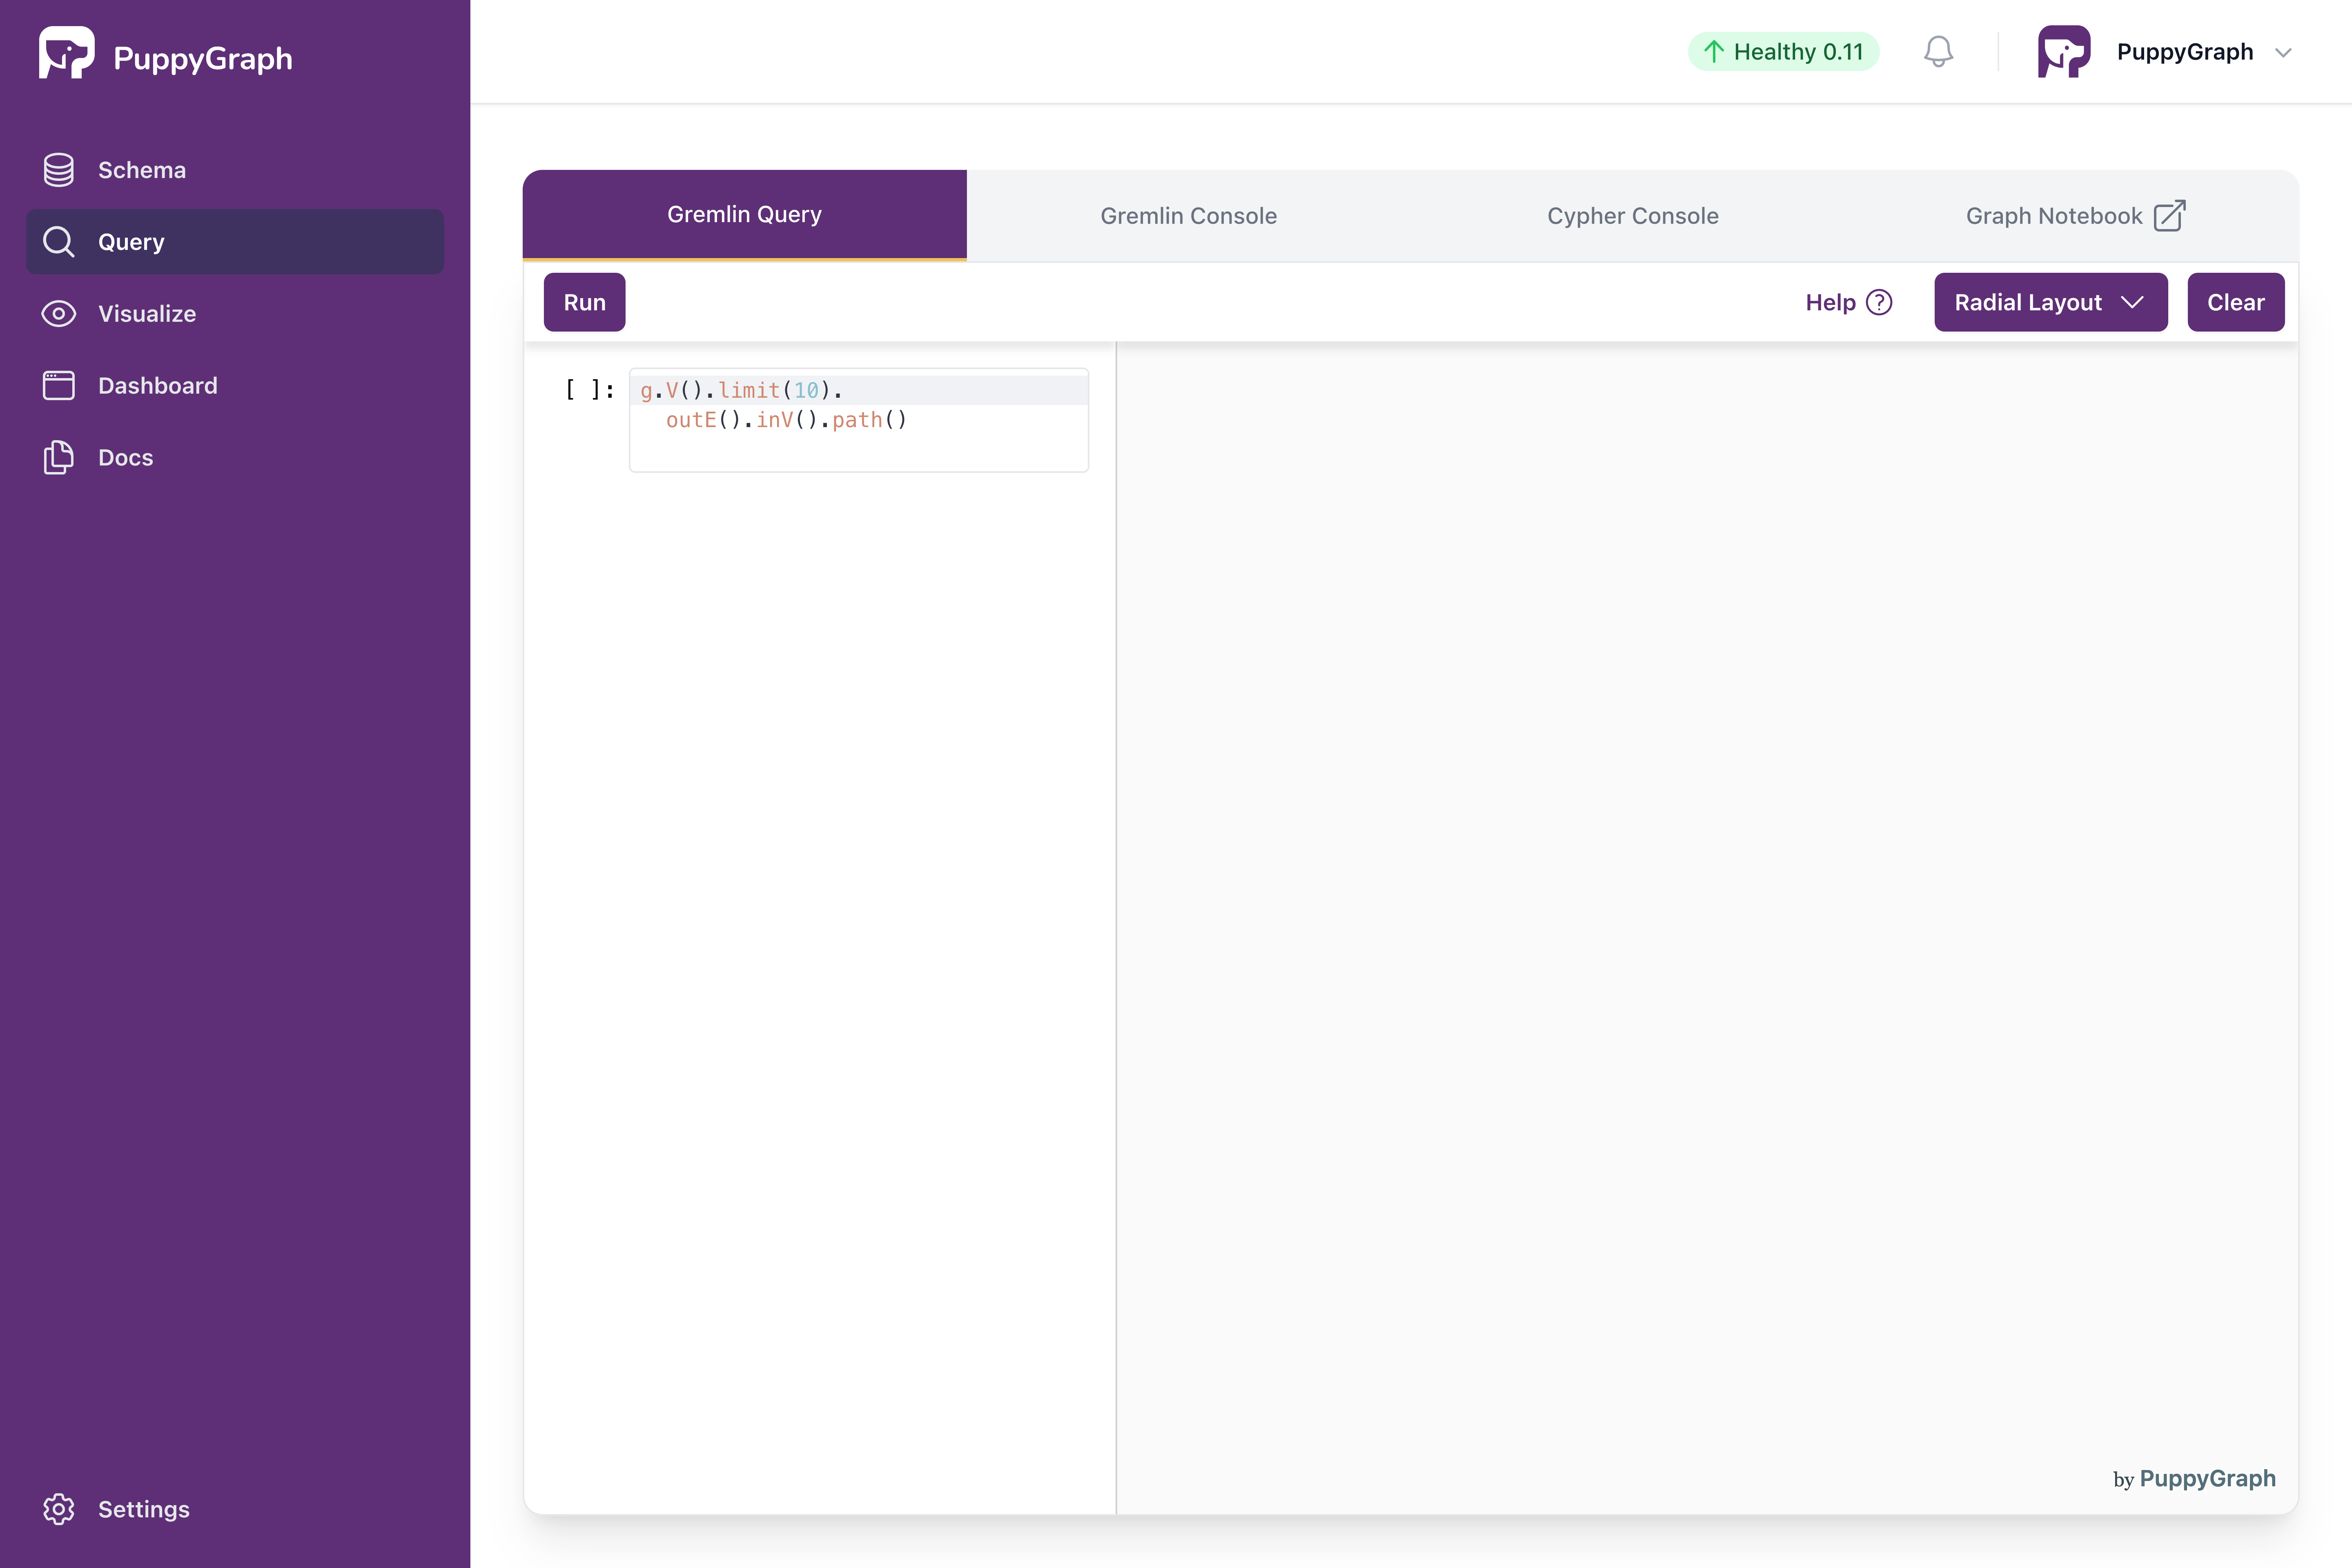
Interactive Gremlin Query Page
Queries are entered on the left side, and the right side displays the graph visualization.
The first query retrieves the property of the person named "marko".
Copy the following query, paste it in the query input, and click on the run button.
The output is plain text like the following:
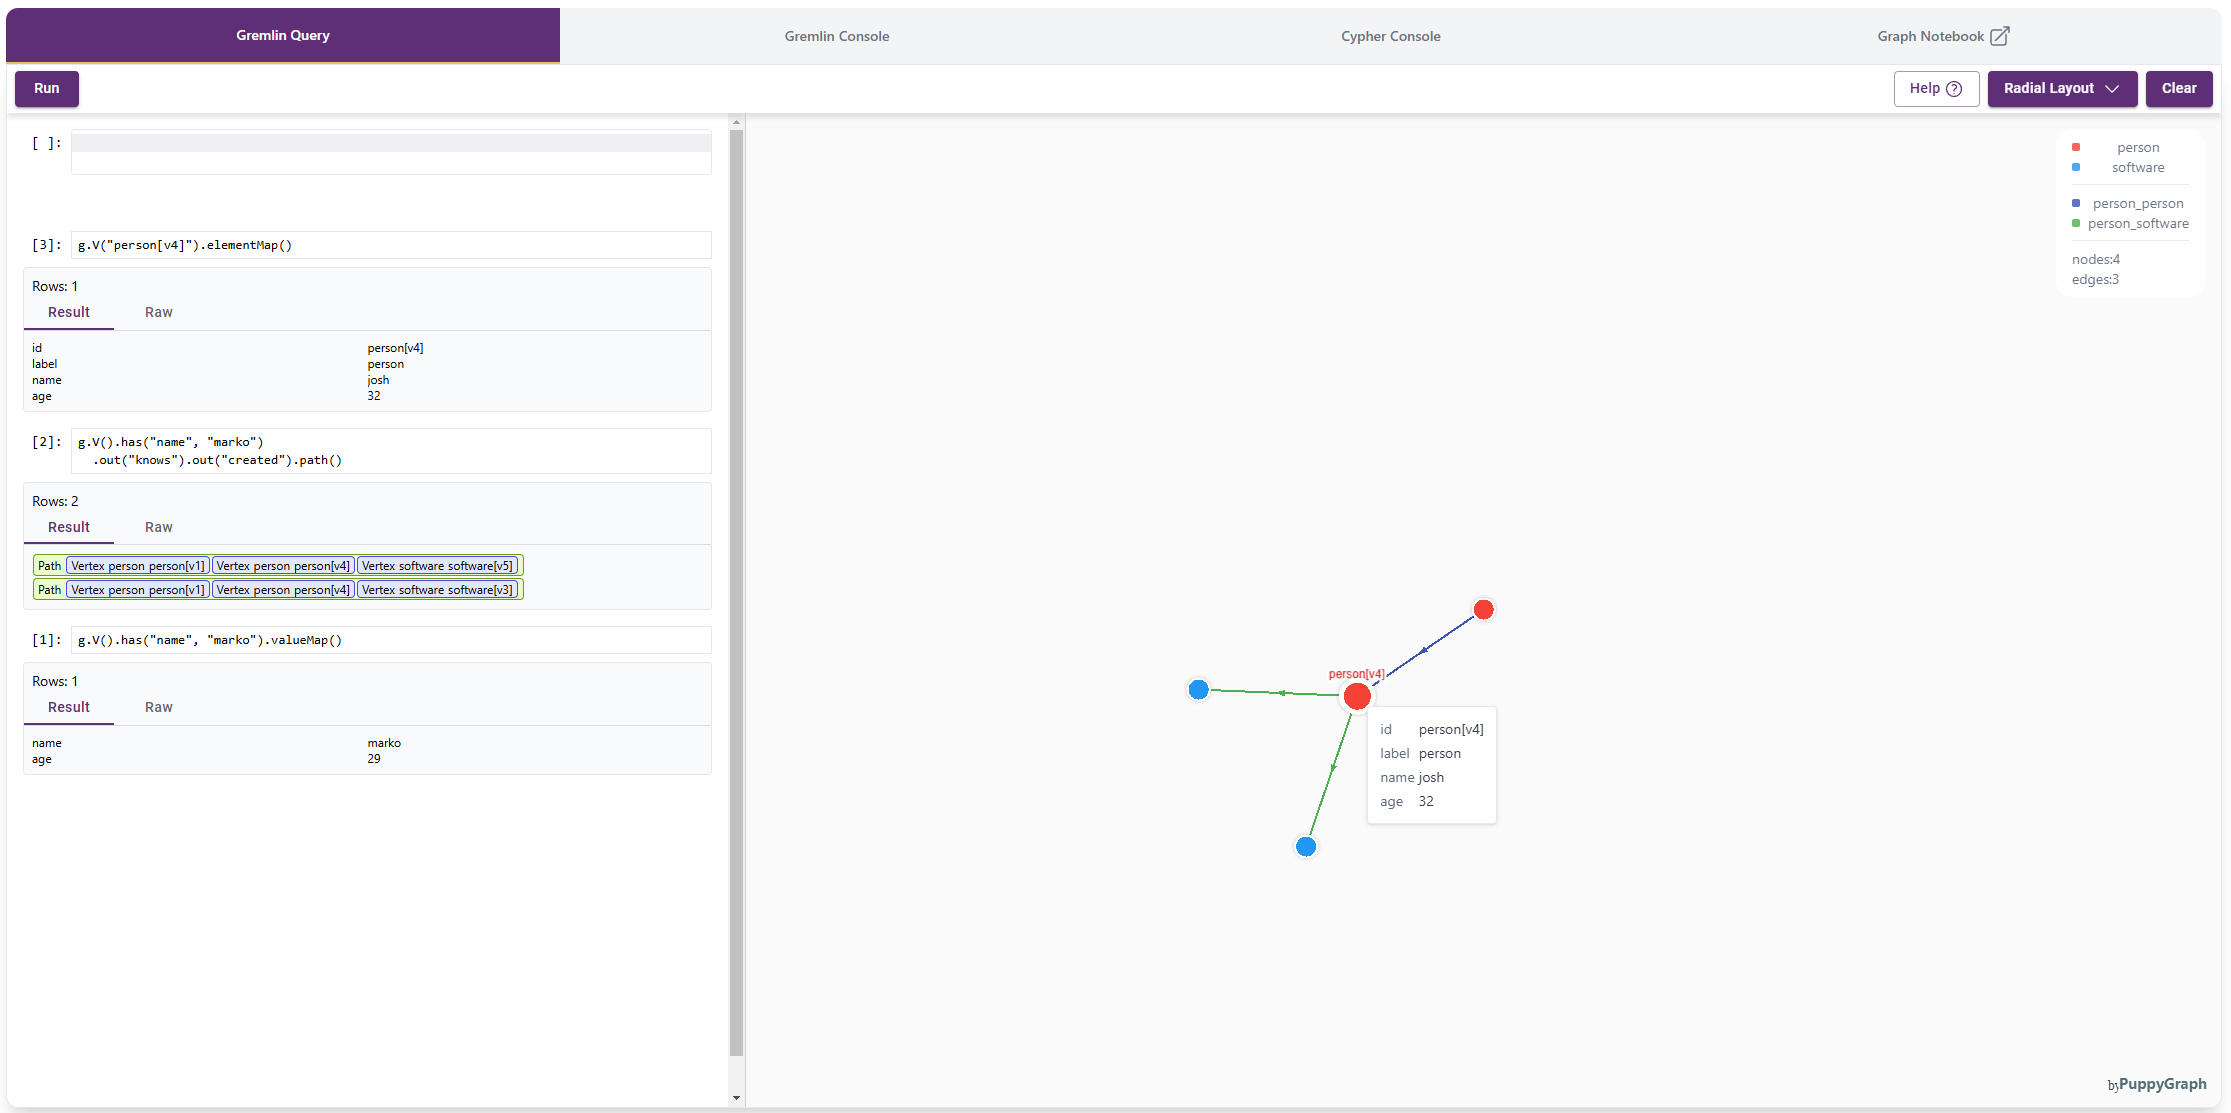
Now let's also leverage the visualization. The next query gets all the software created by people known to "marko".
Copy the following query, paste it in the query input, and click on the run button.
The output is as follows. There are two paths in the result as "marko" knows "josh" who created "lop" and "ripple".
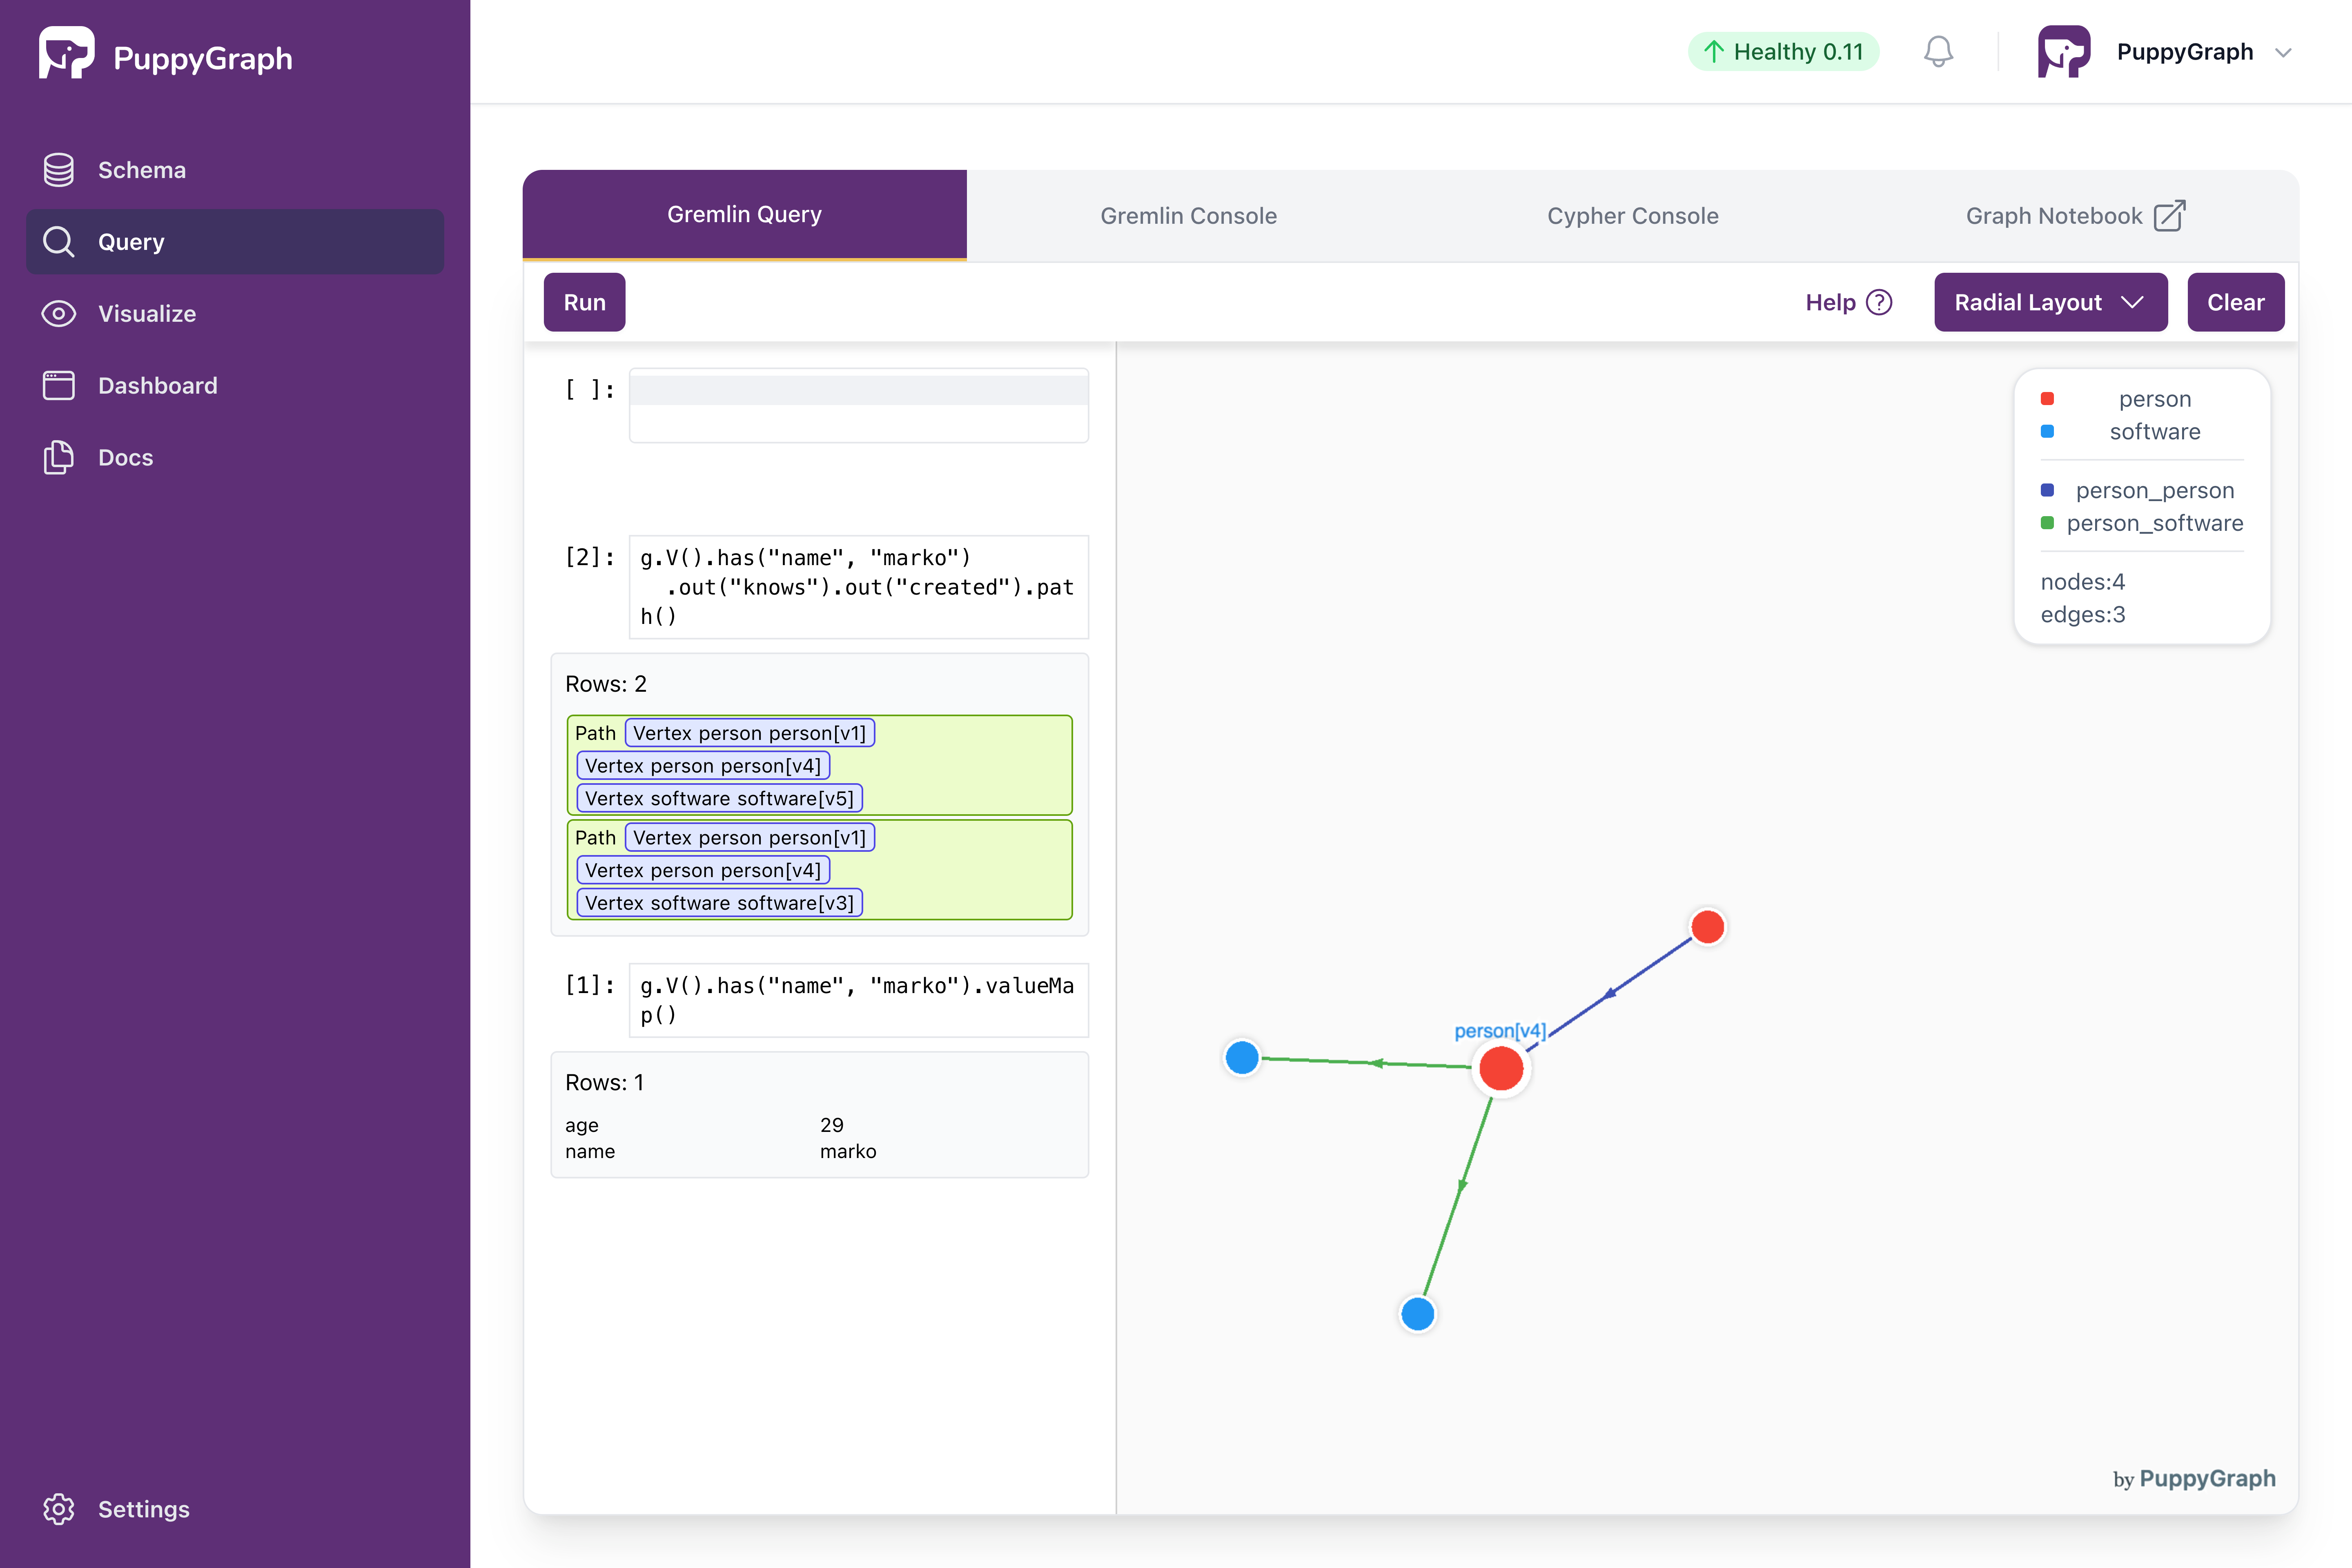
Interactive Query with Results
Alternative: Querying the graph via CLI
Alternatively, we can query the graph via CLI.
Execute the following command to access the PuppyGraph CLI.
The welcome screen appears as follows:
  ____                                     ____                          _
 |  _ \   _   _   _ __    _ __    _   _   / ___|  _ __    __ _   _ __   | |__
 | |_) | | | | | | '_ \  | '_ \  | | | | | |  _  | '__|  / _` | | '_ \  | '_ \
 |  __/  | |_| | | |_) | | |_) | | |_| | | |_| | | |    | (_| | | |_) | | | | |
 |_|      \__,_| | .__/  | .__/   \__, |  \____| |_|     \__,_| | .__/  |_| |_|
                 |_|     |_|      |___/                         |_|
Welcome to PuppyGraph, type help to see the command list
[PuppyGraph]>
               console         access PuppyGraph Gremlin Console
               cypher-console  access PuppyGraph Cypher Console
               groovy          access console to run complex groovy scripts
               exit            exit PuppyGraph
               help            show the command list
Access the PuppyGraph Gremlin Console through the console command.
[PuppyGraph]> console
  ____                                     ____                          _
 |  _ \   _   _   _ __    _ __    _   _   / ___|  _ __    __ _   _ __   | |__
 | |_) | | | | | | '_ \  | '_ \  | | | | | |  _  | '__|  / _` | | '_ \  | '_ \
 |  __/  | |_| | | |_) | | |_) | | |_| | | |_| | | |    | (_| | | |_) | | | | |
 |_|      \__,_| | .__/  | .__/   \__, |  \____| |_|     \__,_| | .__/  |_| |_|
                 |_|     |_|      |___/                         |_|
Welcome to PuppyGraph!
version: 0.11

To Learn more about the graph schema:
- Use graph.show() to list all the node (vertex) and edge labels.
- Use graph.show('$FOO') to list all the node (vertex) and edge labels related to $FOO.
- Use graph.describe('$BAR') to list all the attributes of the label $BAR.

See https://tinkerpop.apache.org/gremlin.html to learn more about the Gremlin query language.
Here are some example queries for exploring the graph:
- Use g.V() to list all the nodes (vertices).
- Use g.E() to list all the edges.
- Use g.V().count() to get the total number of nodes (vertices).
- Use g.E().count() to get the total number of edges.
- Use g.V('$ID').out() to find out nodes (vertices) that are reachable in 1-hop from the node (vertex) $ID. For example, g.V('person[v1]').out() will find out 1-hop reachable nodes (vertices) from 'person[v1]'.
- Use g.V('$ID').out().out() similarly to find out 2-hop reachable nodes (vertices) from the node (vertex) $ID.

puppy-gremlin>
Run the following queries in the console to query the Graph.
Properties of the person named "marko":
Exit Gremlin console by :x and then access Cypher console by cypher-console.
Make sure to initiate Cypher queries using the prefix :>.
puppy-cypher> :> MATCH (v) RETURN count(*)
==>[count(*):6]
puppy-cypher> :> MATCH (v) RETURN v
==>[v:[_type:node,name:peter,_id:person[v6],_label:person,age:35]]
==>[v:[_type:node,name:vadas,_id:person[v2],_label:person,age:27]]
==>[v:[_type:node,name:josh,_id:person[v4],_label:person,age:32]]
==>[v:[_type:node,name:marko,_id:person[v1],_label:person,age:29]]
==>[v:[_type:node,name:ripple,_id:software[v5],lang:java,_label:software]]
==>[v:[_type:node,name:lop,_id:software[v3],lang:java,_label:software]]
Exit Cypher console and the CLI by :x and then exit command.
Cleaning up
Run the following command to shut down and remove the services: