Querying DuckDB Data as a Graph
Summary
In this tutorial, you will:
- Create a DuckDB database and load it with example data;
- Start a PuppyGraph Docker container and query the DuckDB data as a graph.
Prerequisites
Please ensure that docker compose is available. The installation can be verified by running:
See https://docs.docker.com/compose/install/ for Docker Compose installation instructions and https://www.docker.com/get-started/ for more details on Docker.
Accessing the PuppyGraph Web UI requires a browser. However, the tutorial offers alternative instructions for those who wish to exclusively use the CLI.
Deployment
 Create a file
 docker-compose.yaml with the following content:
docker-compose.yaml
version: "3"

services:
  puppygraph:
    image: puppygraph/puppygraph:stable
    pull_policy: always
    container_name: puppygraph
    environment:
      - PUPPYGRAPH_USERNAME=puppygraph
      - PUPPYGRAPH_PASSWORD=puppygraph123
    networks:
      duckdb_net:
    ports:
      - "8081:8081"
      - "8182:8182"
      - "7687:7687"
    volumes:
      - share_content:/home/share
  duckdb:
    image: puppygraph/duckdb-ubuntu:latest
    container_name: duckdb
    networks:
      duckdb_net:
    volumes:
      - share_content:/home/share
networks:
  duckdb_net:
    name: puppy-duckdb
volumes:
  share_content:
    name: puppy-duckdb
Then run the following command to start DuckDB and PuppyGraph:
[+] Running 1/1
 ✔ puppygraph Pulled                                                                                                                                                                                                                                                              2.0s
[+] Running 4/4
 ✔ Network puppy-duckdb   Created                                                                                                                                                                                                                                                 0.1s
 ✔ Volume "puppy-duckdb"  Created                                                                                                                                                                                                                                                 0.0s
 ✔ Container puppygraph   Started                                                                                                                                                                                                                                                 0.1s
 ✔ Container duckdb       Started
Data Preparation
This tutorial is designed to be comprehensive and standalone, so it includes steps to populate data in DuckDB. In practical scenarios, PuppyGraph can query data directly from your existing DuckDB databases.
Run the following command to start a DuckDB shell:
This command also creates a database file /home/share/demo.db.
Then execute the following SQL statements in the shell to create tables and insert data.
create schema modern;
create table modern.person (id text, name text, age integer);
insert into modern.person values
                              ('v1', 'marko', 29),
                              ('v2', 'vadas', 27),
                              ('v4', 'josh', 32),
                              ('v6', 'peter', 35);

create table modern.software (id text, name text, lang text);
insert into modern.software values
                                ('v3', 'lop', 'java'),
                                ('v5', 'ripple', 'java');

create table modern.created (id text, from_id text, to_id text, weight double precision);
insert into modern.created values
                               ('e9', 'v1', 'v3', 0.4),
                               ('e10', 'v4', 'v5', 1.0),
                               ('e11', 'v4', 'v3', 0.4),
                               ('e12', 'v6', 'v3', 0.2);

create table modern.knows (id text, from_id text, to_id text, weight double precision);
insert into modern.knows values
                             ('e7', 'v1', 'v2', 0.5),
                             ('e8', 'v1', 'v4', 1.0);
The above SQL creates the following tables:
| id | name | age |
|---|---|---|
| v1 | marko | 29 |
| v2 | vadas | 27 |
| v4 | josh | 32 |
| v6 | peter | 35 |
| id | name | lang |
|---|---|---|
| v3 | lop | java |
| v5 | ripple | java |
| id | from_id | to_id | weight |
|---|---|---|---|
| e7 | v1 | v2 | 0.5 |
| e8 | v1 | v4 | 1.0 |
| id | from_id | to_id | weight |
|---|---|---|---|
| e9 | v1 | v3 | 0.4 |
| e10 | v4 | v5 | 1.0 |
| e11 | v4 | v3 | 0.4 |
| e12 | v6 | v3 | 0.2 |
Type .exit to quit the DuckDB shell.
Modeling a Graph
We then define a graph on top of the data tables we just created. Actually, this is the "Modern" graph defined by Apache Tinkerpop.
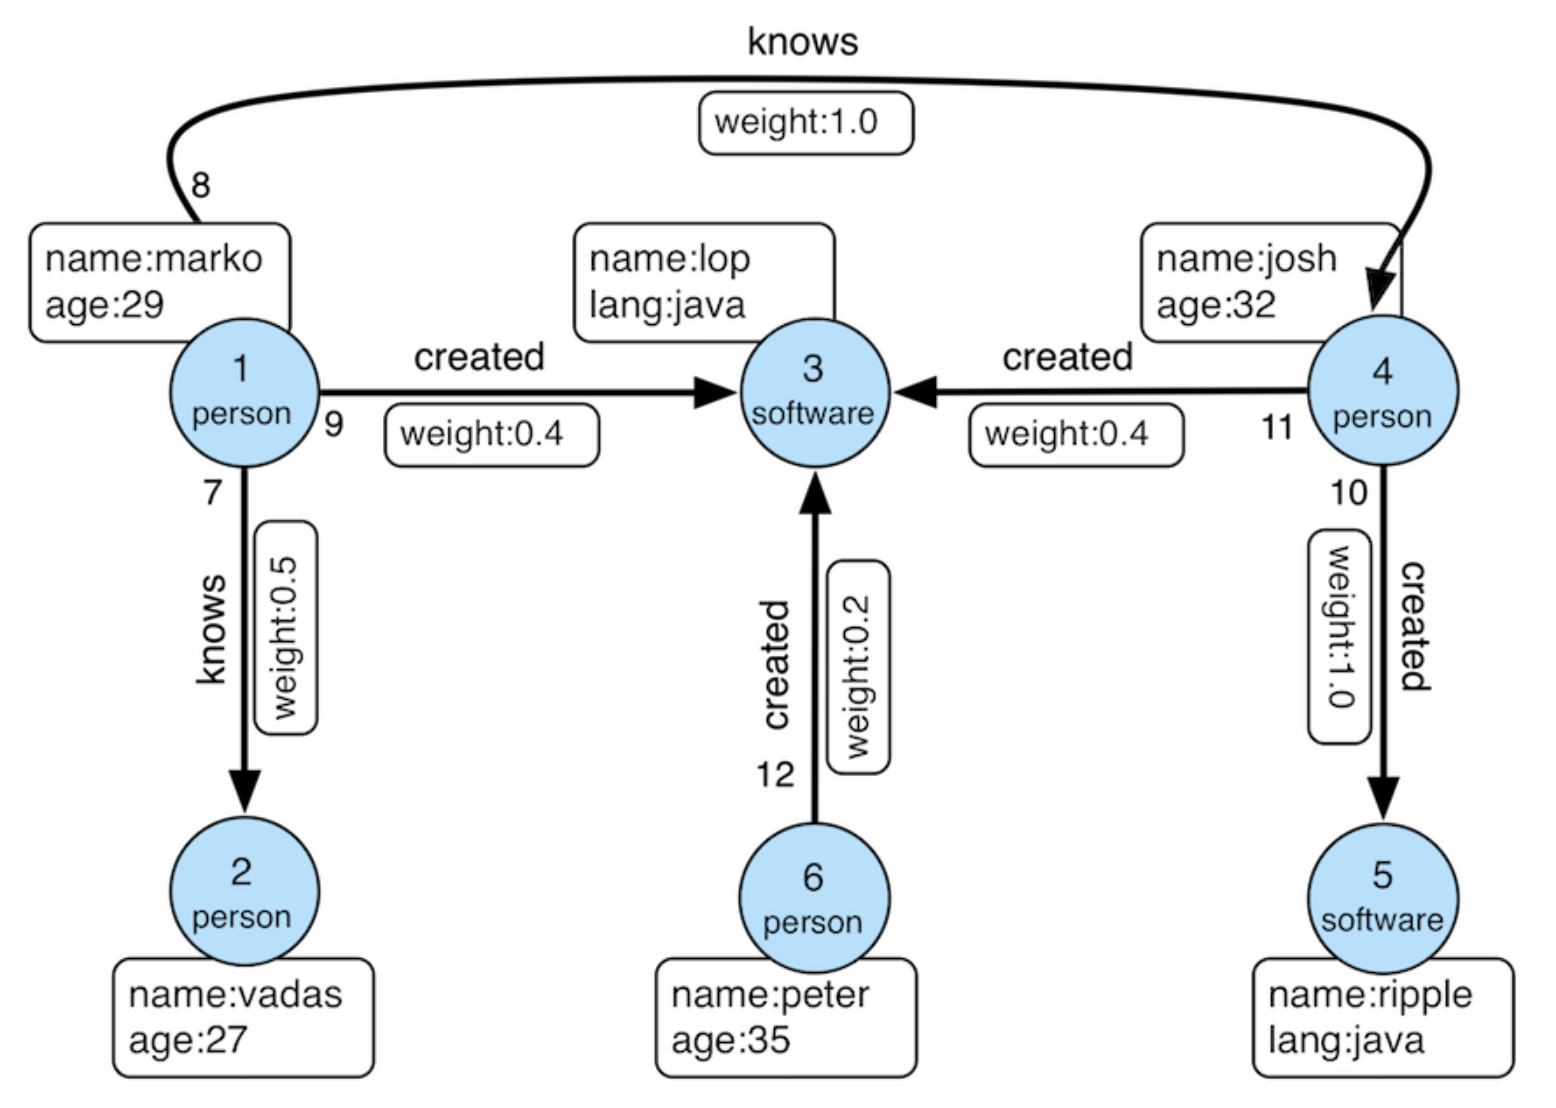
Modern Graph
A schema instructs PuppyGraph on mapping data from the DuckDB into a graph. PuppyGraph offers various methods for schema creation. For this tutorial, we've already prepared a schema to help save time.
Create a PuppyGraph schema file schema.json with the following content:
schema.json
{
  "catalogs": [
    {
      "name": "duckdb_data",
      "type": "duckdb",
      "jdbc": {
        "jdbcUri": "jdbc:duckdb:/home/share/demo.db",
        "driverClass": "org.duckdb.DuckDBDriver"
      }
    }
  ],
  "graph": {
    "vertices": [
      {
        "label": "person",
        "oneToOne": {
          "tableSource": {
            "catalog": "duckdb_data",
            "schema": "modern",
            "table": "person"
          },
          "id": {
            "fields": [
              {
                "type": "String",
                "field": "id",
                "alias": "id"
              }
            ]
          },
          "attributes": [
            {
              "type": "Int",
              "field": "age",
              "alias": "age"
            },
            {
              "type": "String",
              "field": "name",
              "alias": "name"
            }
          ]
        }
      },
      {
        "label": "software",
        "oneToOne": {
          "tableSource": {
            "catalog": "duckdb_data",
            "schema": "modern",
            "table": "software"
          },
          "id": {
            "fields": [
              {
                "type": "String",
                "field": "id",
                "alias": "id"
              }
            ]
          },
          "attributes": [
            {
              "type": "String",
              "field": "lang",
              "alias": "lang"
            },
            {
              "type": "String",
              "field": "name",
              "alias": "name"
            }
          ]
        }
      }
    ],
    "edges": [
      {
        "label": "knows",
        "fromVertex": "person",
        "toVertex": "person",
        "tableSource": {
          "catalog": "duckdb_data",
          "schema": "modern",
          "table": "knows"
        },
        "id": {
          "fields": [
            {
              "type": "String",
              "field": "id",
              "alias": "id"
            }
          ]
        },
        "fromId": {
          "fields": [
            {
              "type": "String",
              "field": "from_id",
              "alias": "from_id"
            }
          ]
        },
        "toId": {
          "fields": [
            {
              "type": "String",
              "field": "to_id",
              "alias": "to_id"
            }
          ]
        },
        "attributes": [
          {
            "type": "Double",
            "field": "weight",
            "alias": "weight"
          }
        ]
      },
      {
        "label": "created",
        "fromVertex": "person",
        "toVertex": "software",
        "tableSource": {
          "catalog": "duckdb_data",
          "schema": "modern",
          "table": "created"
        },
        "id": {
          "fields": [
            {
              "type": "String",
              "field": "id",
              "alias": "id"
            }
          ]
        },
        "fromId": {
          "fields": [
            {
              "type": "String",
              "field": "from_id",
              "alias": "from_id"
            }
          ]
        },
        "toId": {
          "fields": [
            {
              "type": "String",
              "field": "to_id",
              "alias": "to_id"
            }
          ]
        },
        "attributes": [
          {
            "type": "Double",
            "field": "weight",
            "alias": "weight"
          }
        ]
      }
    ]
  }
}
Log into PuppyGraph Web UI at http://localhost:8081 with username puppygraph and password puppygraph123.
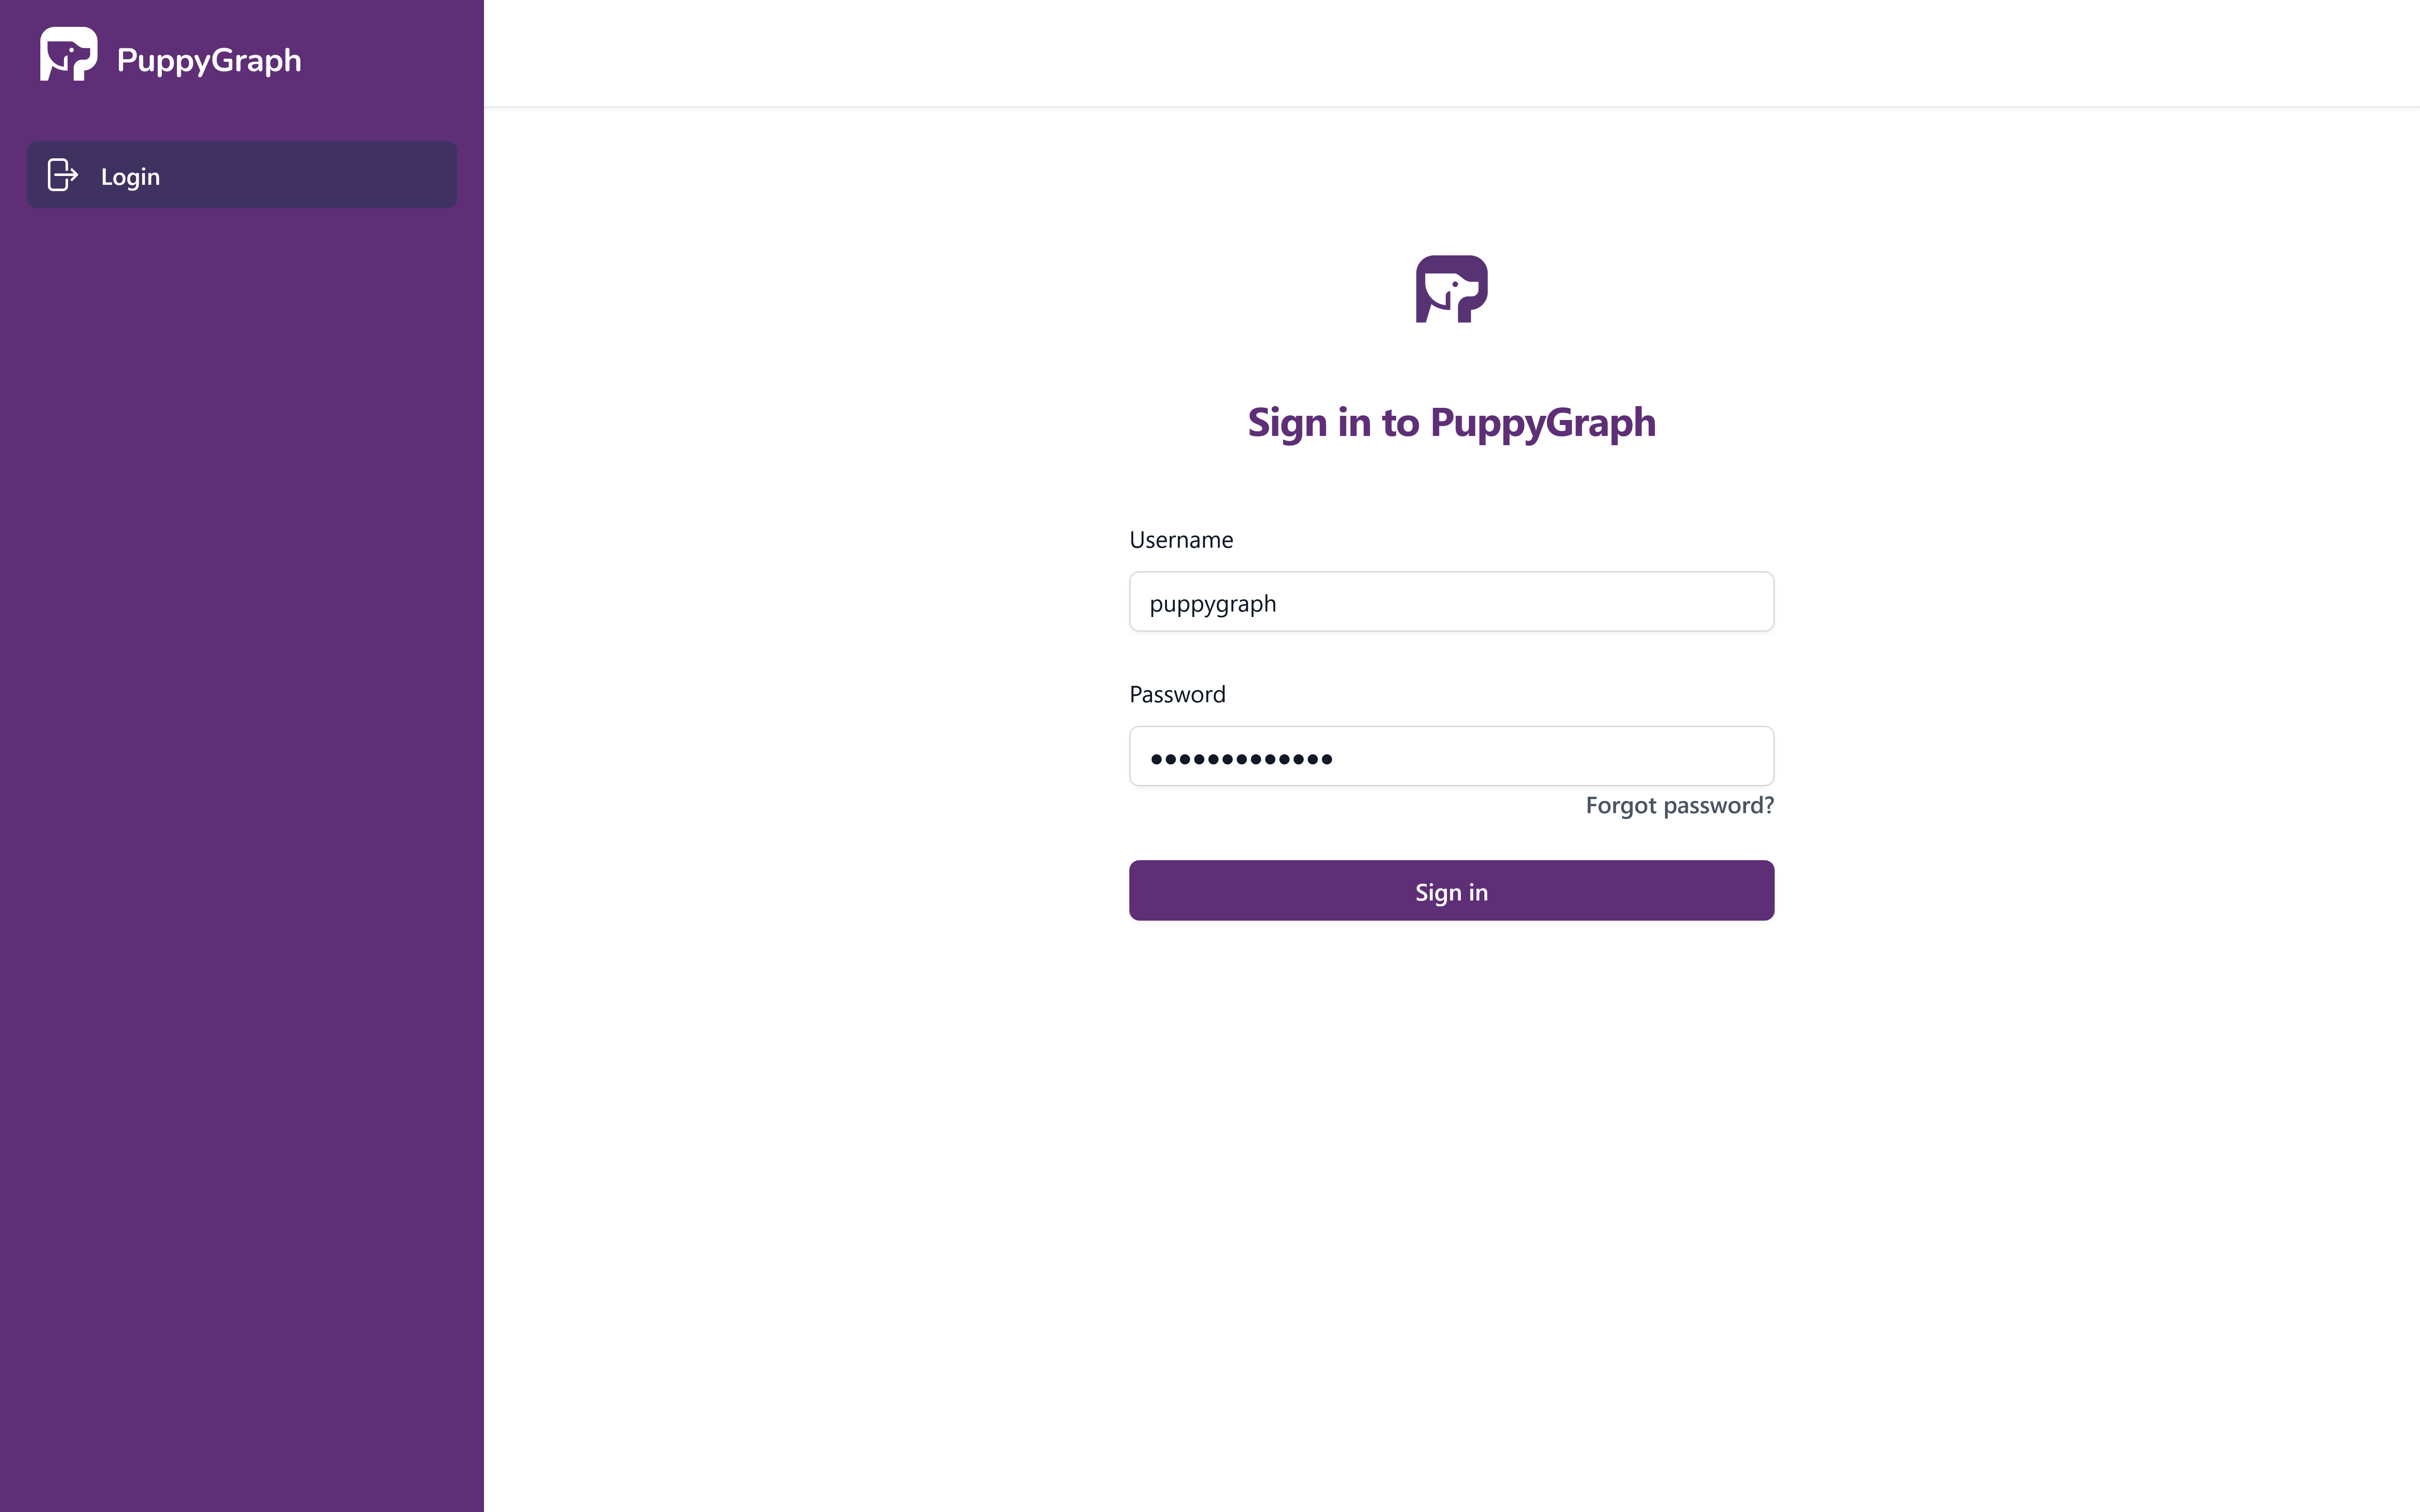
PuppyGraph Login
Upload the schema by selecting the file schema.json in the Upload Graph Schema JSON block and clicking on Upload.
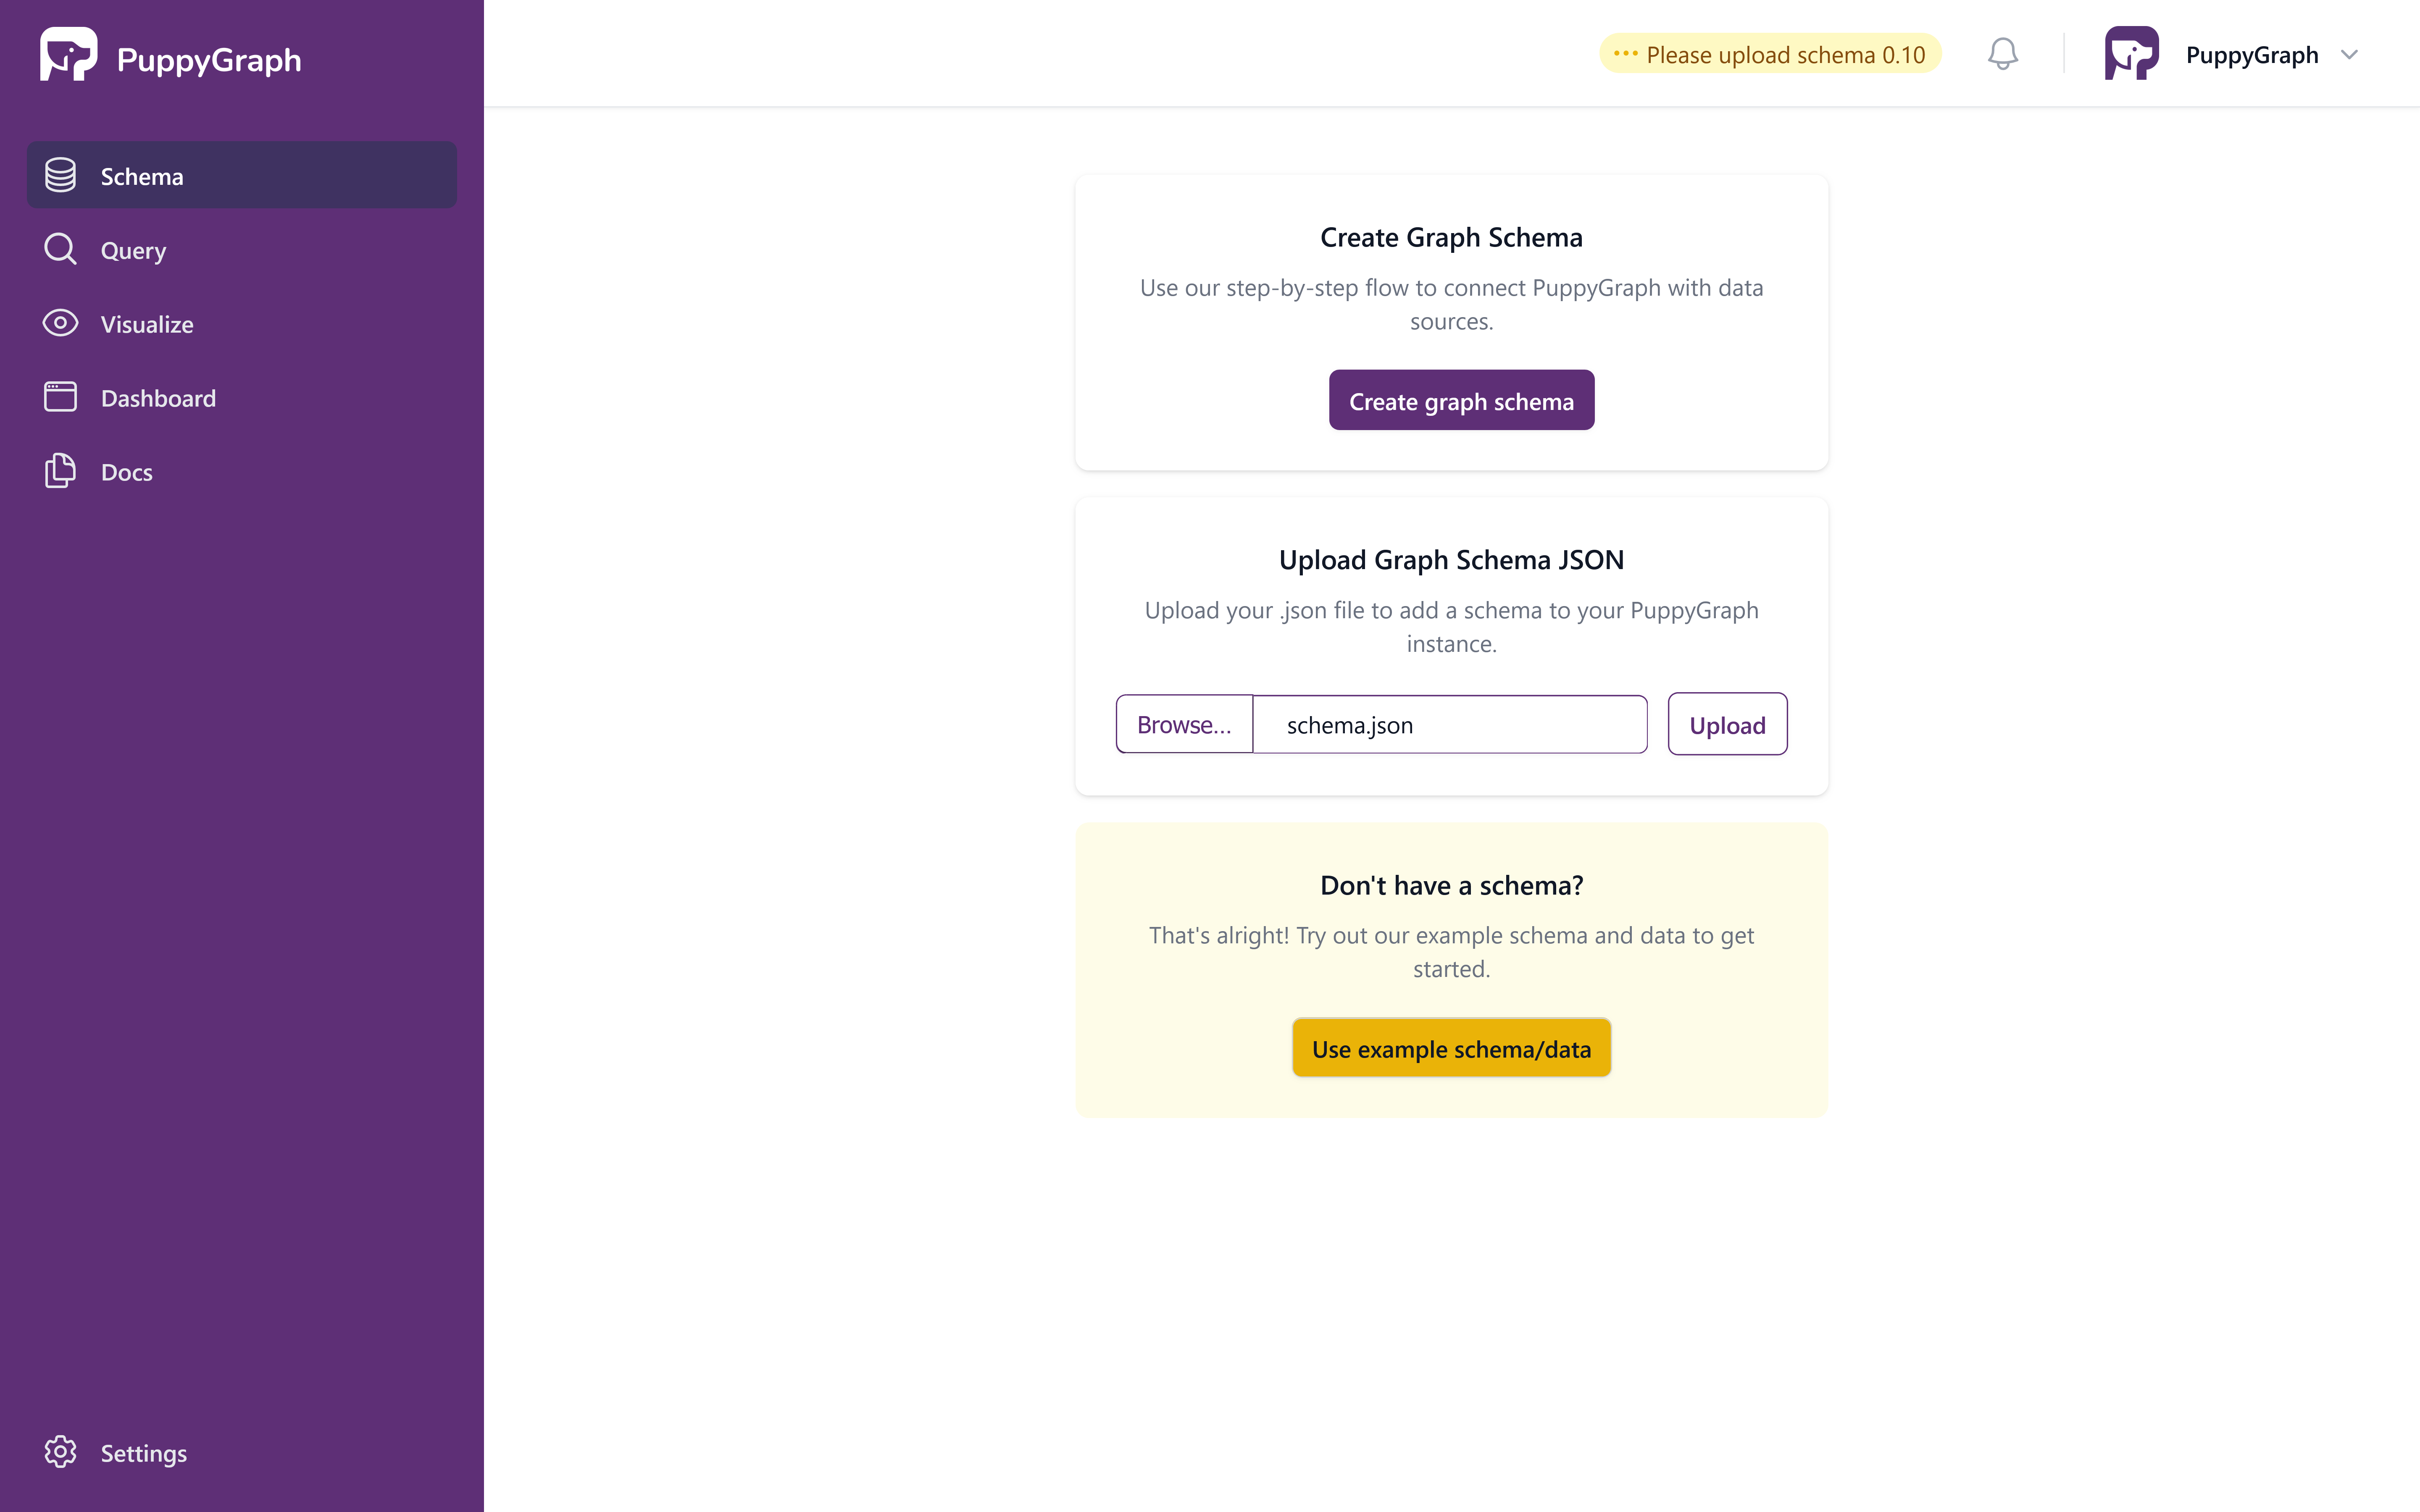
Upload Schema Page
Once the schema is uploaded, the schema page shows the visualized graph schema as follows.
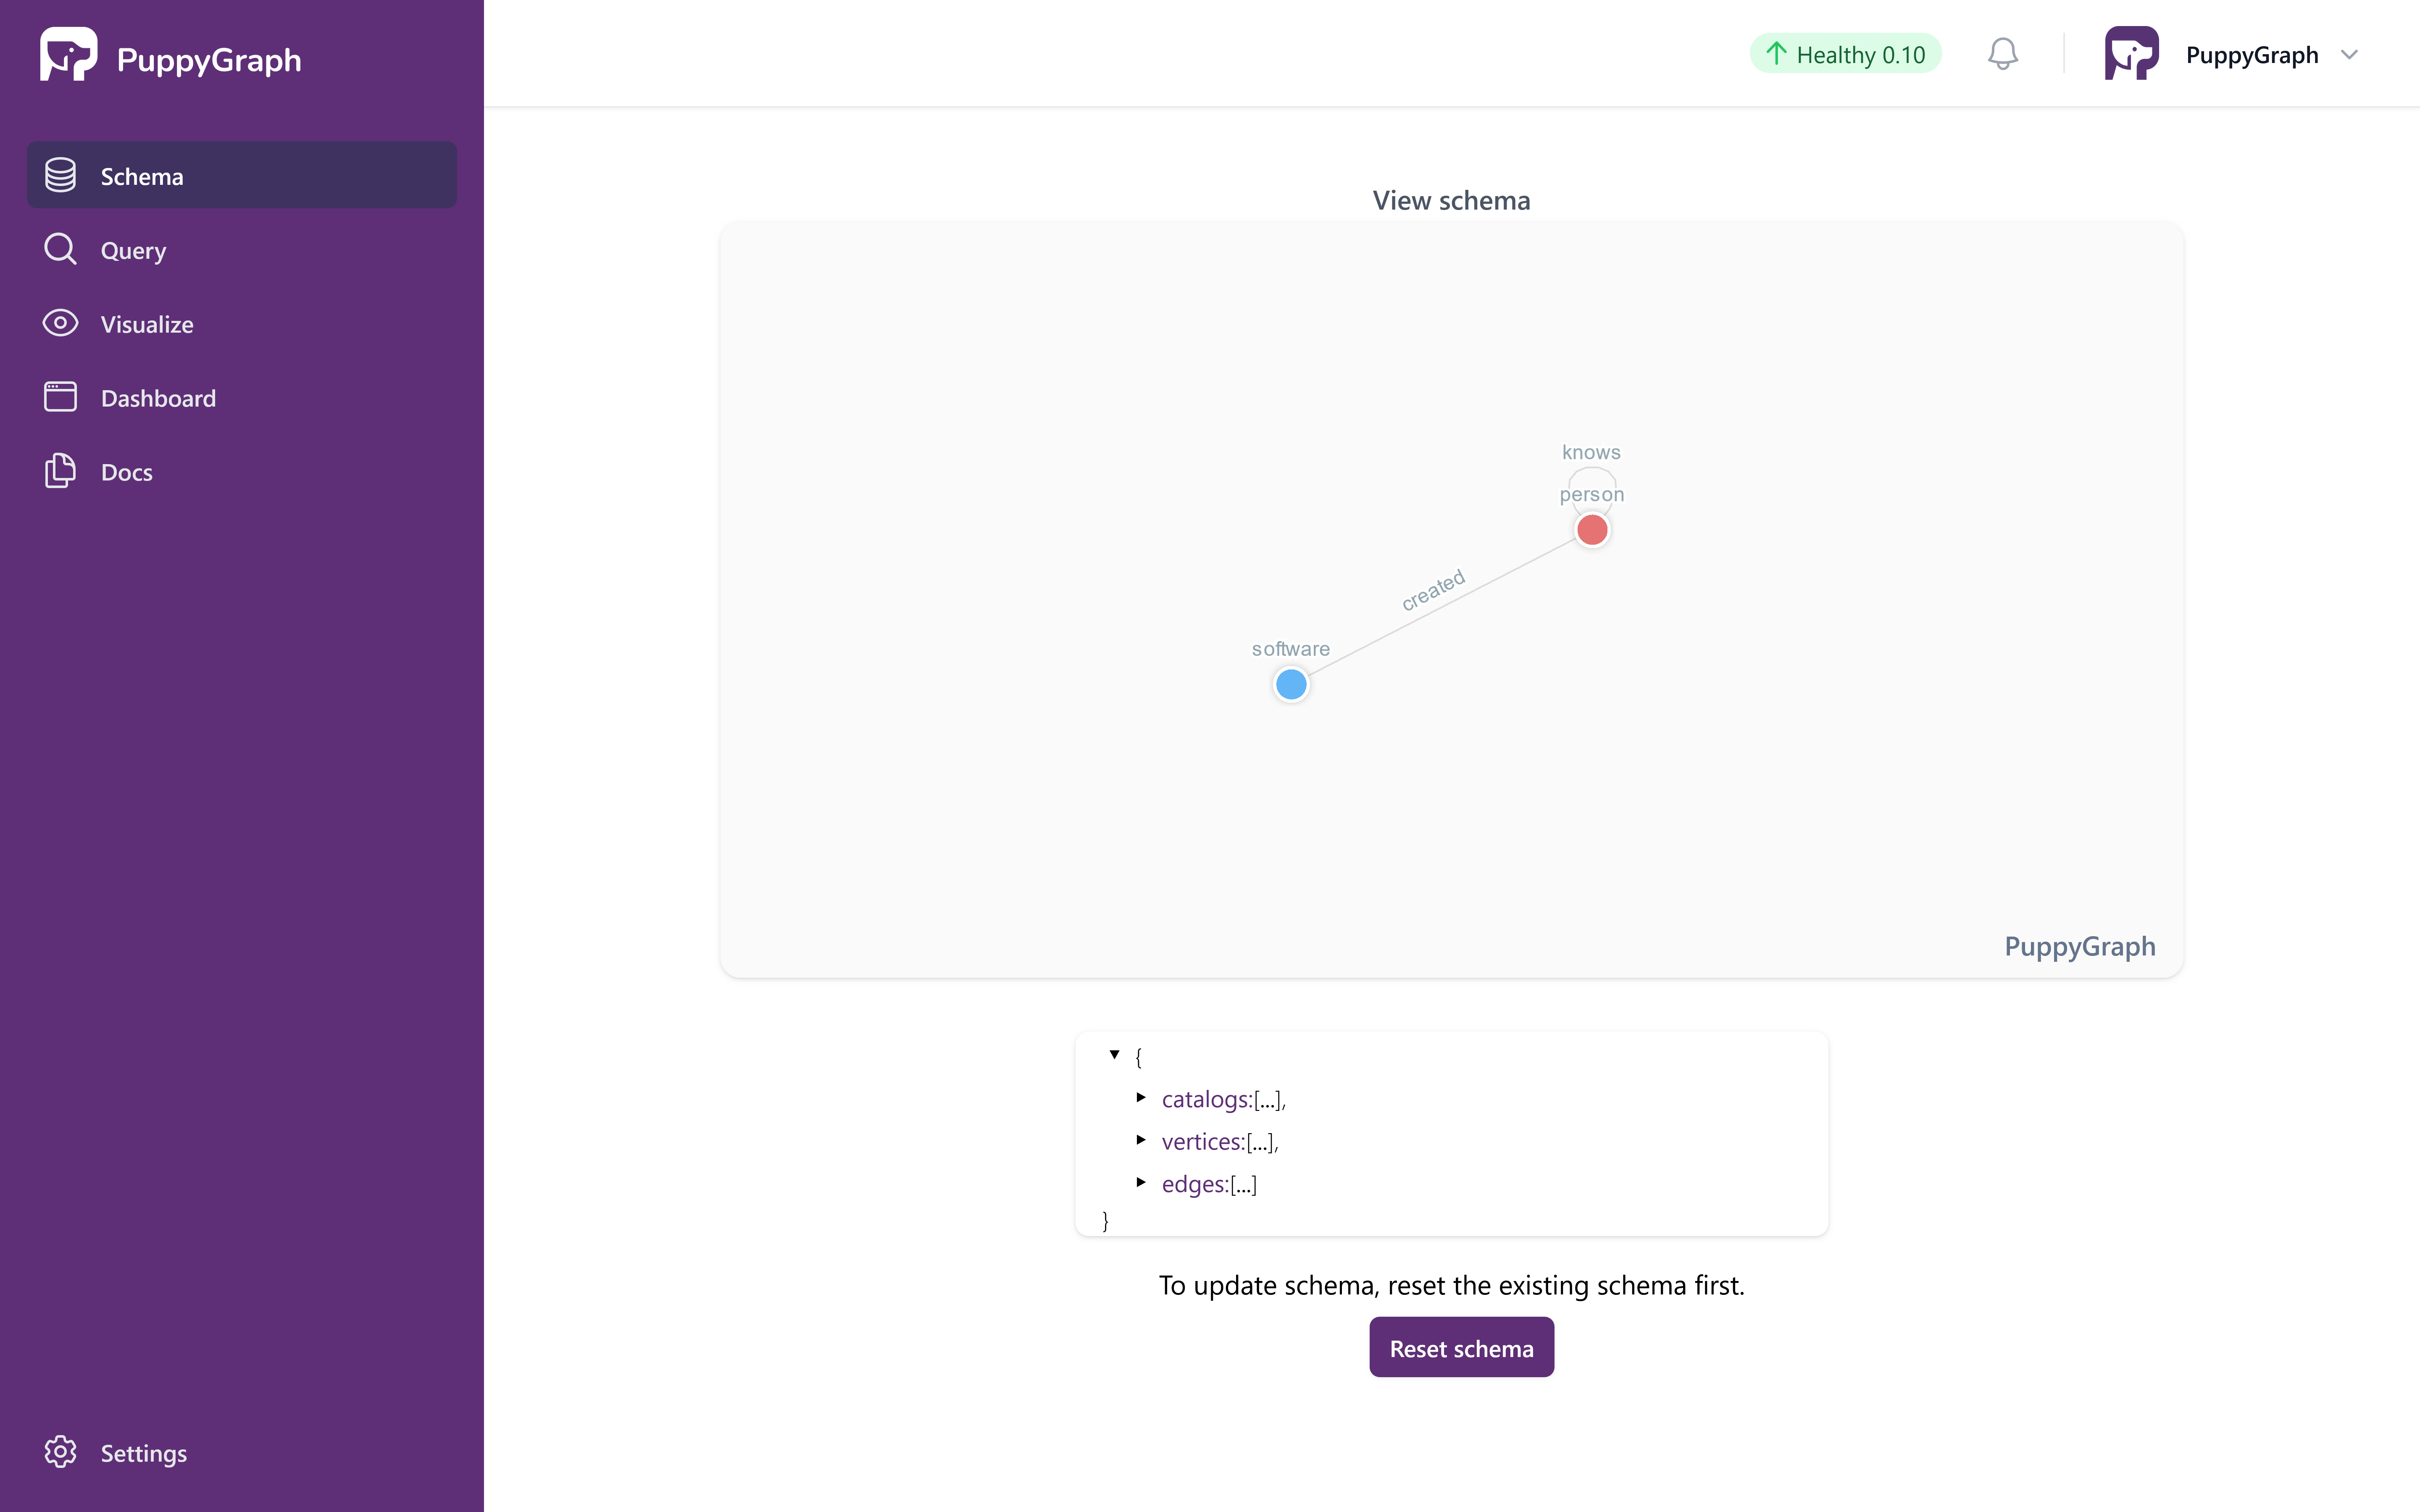
Visualized Schema
Alternative: Schema Uploading via CLI
Alternatively, run the following command to upload the schema file:
curl -XPOST -H "content-type: application/json" --data-binary @./schema.json --user "puppygraph:puppygraph123" localhost:8081/schema
The response shows that graph schema has been uploaded successfully:
Querying the Graph
In this tutorial we will use the Gremlin query language to query the Graph. Gremlin is a graph query language developed by Apache TinkerPop. Prior knowledge of Gremlin is not necessary to follow the tutorial. To learn more about it, visit https://tinkerpop.apache.org/gremlin.html.
Click on the Query panel the left side. The Gremlin Query tab offers an interactive environment for querying the graph using Gremlin.
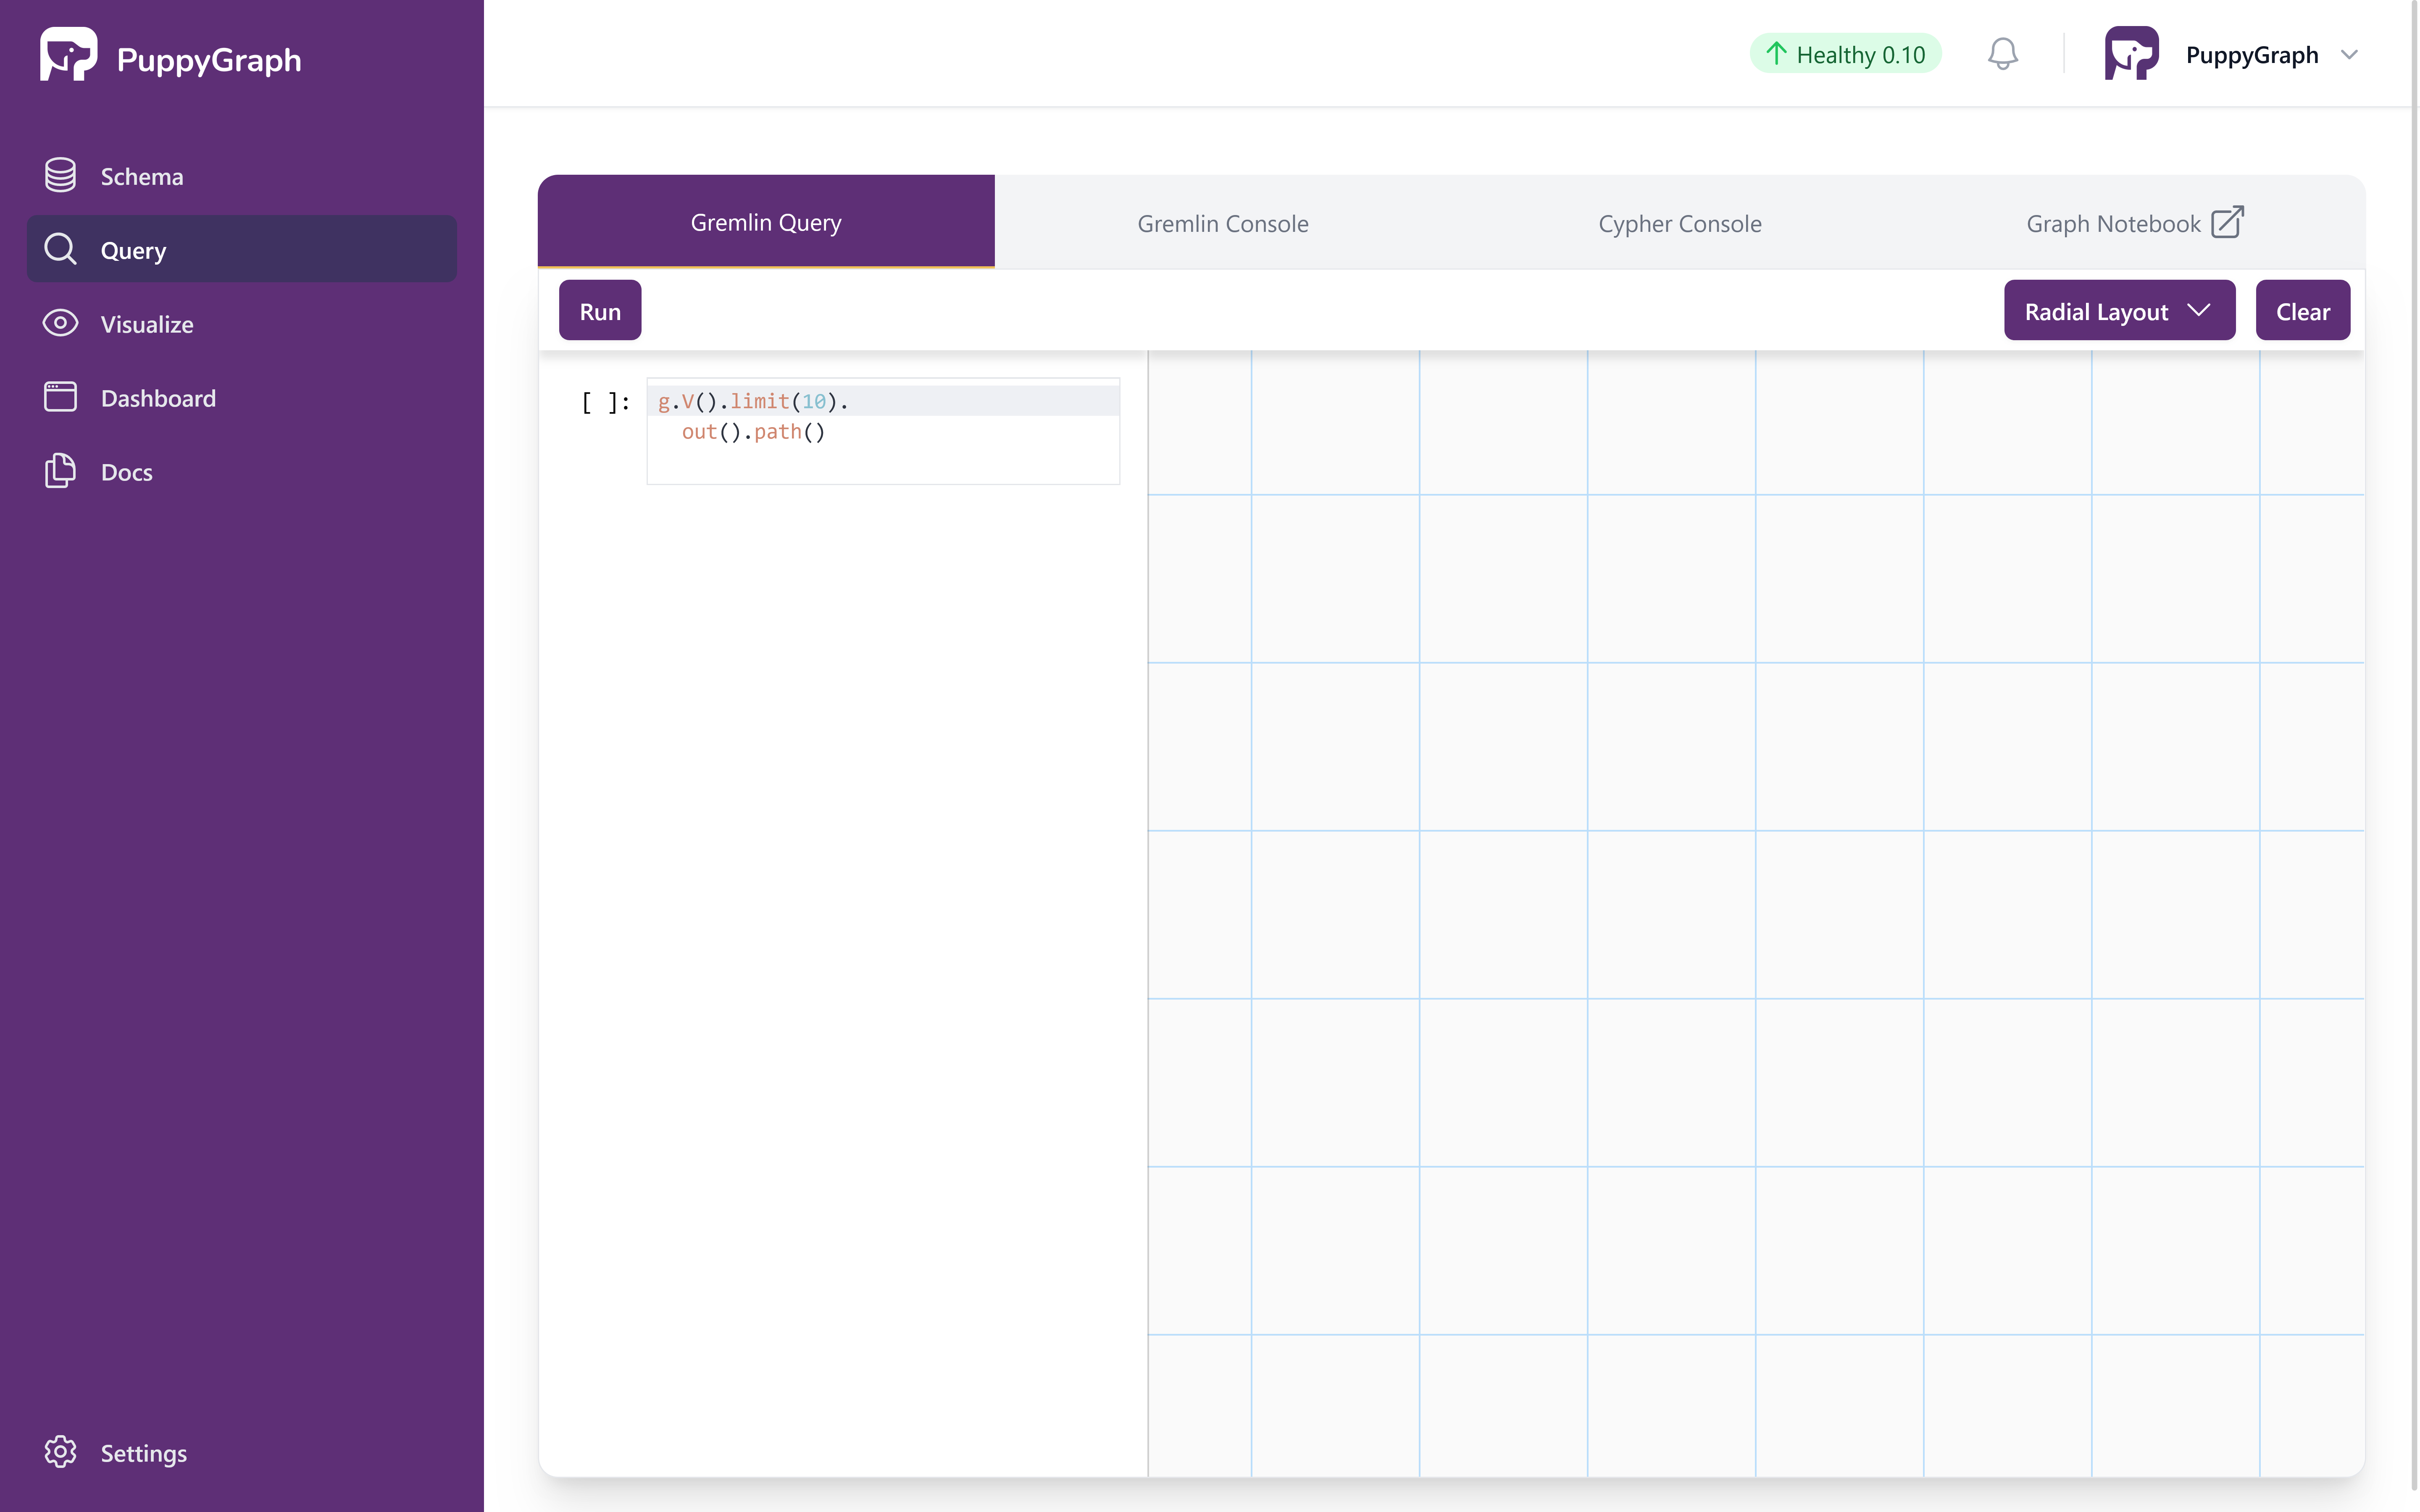
Interactive Gremlin Query Page
Queries are entered on the left side, and the right side displays the graph visualization.
The first query retrieves the property of the person named "marko".
Copy the following query, paste it in the query input, and click on the run button.
The output is plain text like the following:
Now let's also leverage the visualization. The next query gets all the software created by people known to "marko".
Copy the following query, paste it in the query input, and click on the run button.
The output is as follows. There are two paths in the result as "marko" knows "josh" who created "lop" and "ripple".
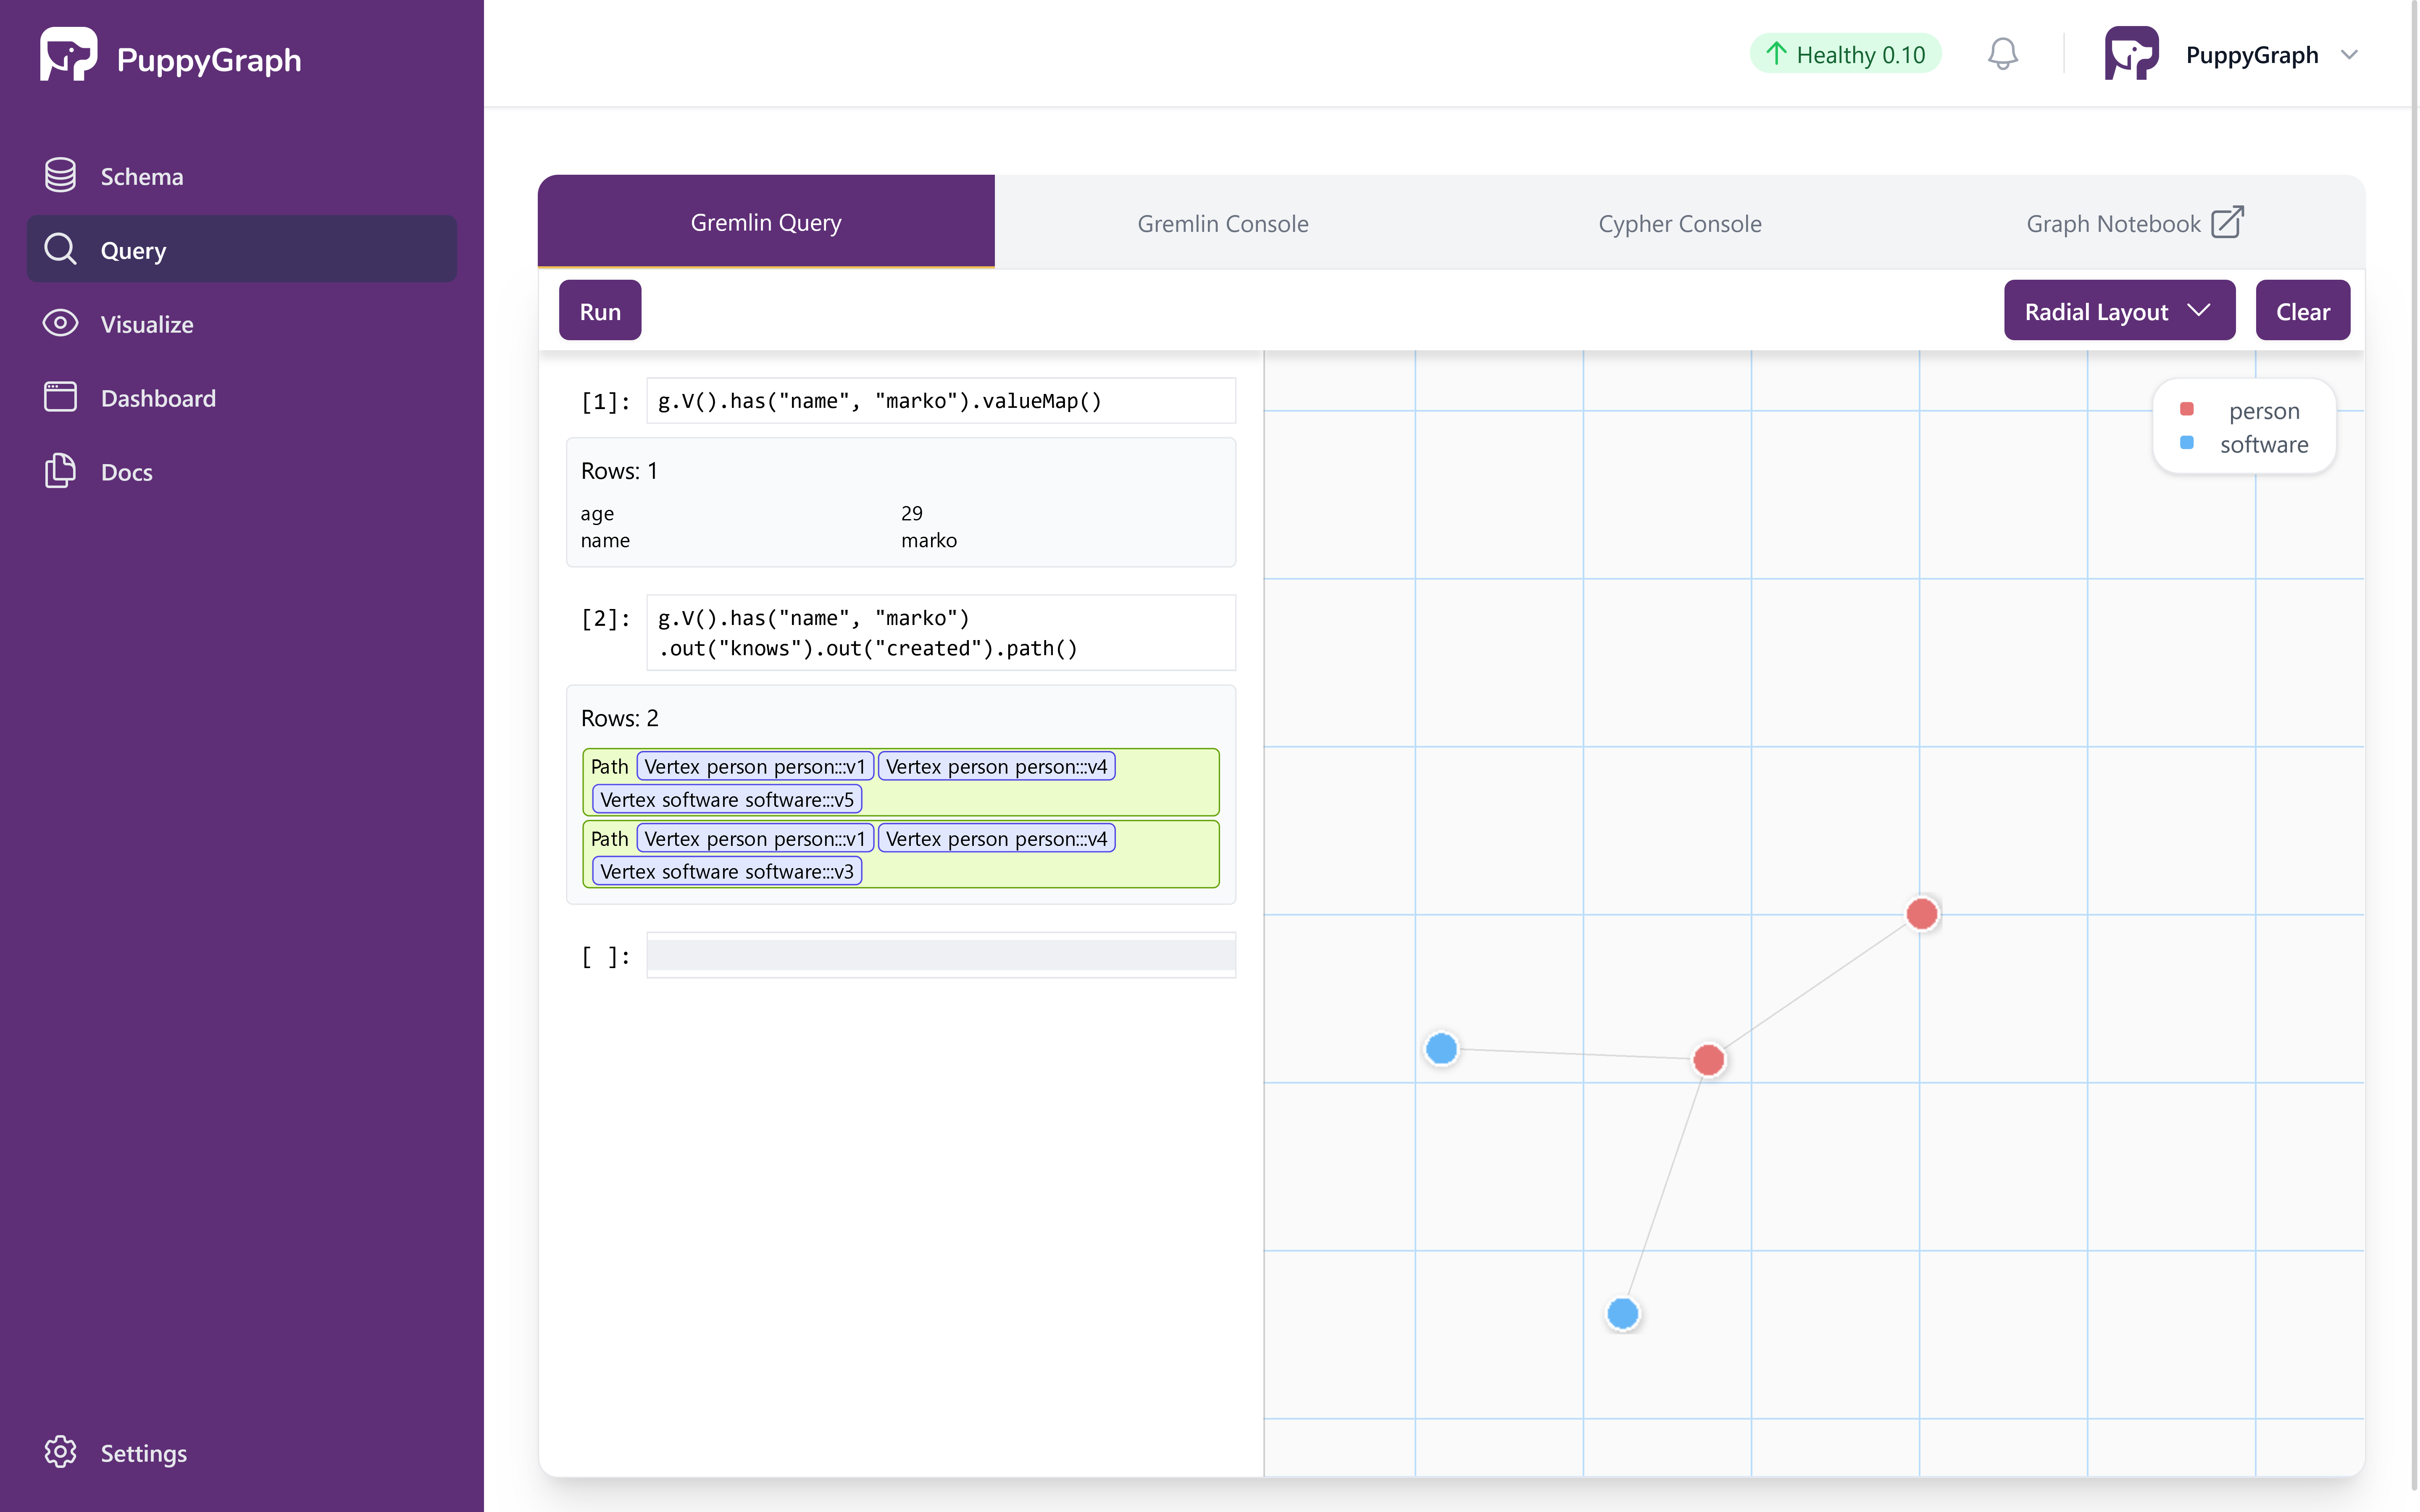
Interactive Query with Results
Alternative: Querying the graph via CLI
Alternatively, we can query the graph via CLI.
Execute the following command to access the PuppyGraph Gremlin CLI
The welcome screen appears as follows:
  ____                                     ____                          _
 |  _ \   _   _   _ __    _ __    _   _   / ___|  _ __    __ _   _ __   | |__
 | |_) | | | | | | '_ \  | '_ \  | | | | | |  _  | '__|  / _` | | '_ \  | '_ \
 |  __/  | |_| | | |_) | | |_) | | |_| | | |_| | | |    | (_| | | |_) | | | | |
 |_|      \__,_| | .__/  | .__/   \__, |  \____| |_|     \__,_| | .__/  |_| |_|
                 |_|     |_|      |___/                         |_|
Welcome to PuppyGraph!
version: 0.10

puppy-gremlin>
Run the following queries in the console to query the Graph.
Properties of the person named "marko":
To exit PuppyGraph Gremlin Console, enter the command:
Cleaning up
Run the following command to shut down and remove the containers:
Remove the data volume if needed: