Querying Nessie Data as a Graph
Summary
In this tutorial, you will:
- Create a Nessie-backed Apache Iceberg data lake and load it with example data;
- Start a PuppyGraph Docker container and query data stored in Project Nessie as a graph.
Note: For the TLS version, see Querying Nessie and Minio Data as a Graph with TLS.
Prerequisites
Please ensure that docker compose is available. The installation can be verified by running:
See https://docs.docker.com/compose/install/ for Docker Compose installation instructions and https://www.docker.com/get-started/ for more details on Docker.
Accessing the PuppyGraph Web UI requires a browser. However, the tutorial offers alternative instructions for those who wish to exclusively use the CLI.
Deployment

docker-compose.yaml with the following content.
docker-compose.yaml
services:
  spark-iceberg:
    image: tabulario/spark-iceberg
    container_name: spark-iceberg
    networks:
      iceberg_net:
    depends_on:
      - minio
      - nessie
    volumes:
      - ./warehouse:/home/iceberg/warehouse
      - ./notebooks:/home/iceberg/notebooks/notebooks
    environment:
      - AWS_ACCESS_KEY_ID=admin
      - AWS_SECRET_ACCESS_KEY=password
      - AWS_REGION=us-east-1
    ports:
      - 8888:8888
      - 8080:8080
      - 10000:10000
      - 10001:10001

  minio:
    image: quay.io/minio/minio
    container_name: minio
    networks:
      iceberg_net:
    ports:
      - 9000:9000
      - 9001:9001
    environment:
      - MINIO_ROOT_USER=admin
      - MINIO_ROOT_PASSWORD=password
      - MINIO_REGION=us-east-1
    entrypoint: >
      /bin/sh -c "
      minio server /data --console-address ':9001' &
      sleep 5;
      mc alias set myminio http://localhost:9000 admin password;
      mc mb myminio/my-bucket --ignore-existing;
      tail -f /dev/null"

  nessie:
    image: ghcr.io/projectnessie/nessie
    container_name: nessie
    networks:
      iceberg_net:
    ports:
      - 19120:19120
    environment:
      - nessie.version.store.type=IN_MEMORY
      - nessie.catalog.default-warehouse=warehouse
      - nessie.catalog.warehouses.warehouse.location=s3://my-bucket
      - nessie.catalog.service.s3.default-options.region=us-east-1
      - nessie.catalog.service.s3.default-options.endpoint=http://minio:9000/
      - nessie.catalog.service.s3.default-options.path-style-access=true
      - nessie.catalog.service.s3.default-options.access-key=urn:nessie-secret:quarkus:nessie.catalog.secrets.access-key
      - nessie.catalog.secrets.access-key.name=admin
      - nessie.catalog.secrets.access-key.secret=password
      - nessie.server.authentication.enabled=false

  puppygraph:
    image: puppygraph/puppygraph:stable
    container_name: puppygraph
    networks:
      iceberg_net:
    environment:
      - PUPPYGRAPH_USERNAME=puppygraph
      - PUPPYGRAPH_PASSWORD=puppygraph123
    ports:
      - "8081:8081"
      - "8182:8182"
      - "7687:7687"
    depends_on:
      - spark-iceberg

networks:
  iceberg_net:

[+] Running 5/5
 ✔ Network nessie_iceberg_net  Created
 ✔ Container nessie            Started
 ✔ Container minio             Started
 ✔ Container spark-iceberg     Started
 ✔ Container puppygraph        Started
Data Preparation
This tutorial is designed to be comprehensive and standalone, so it includes steps to populate data in Nessie. In practical scenarios, PuppyGraph can query data directly from your existing Nessie tables.

docker exec -it spark-iceberg spark-sql \
--conf spark.sql.catalog.demo=org.apache.iceberg.spark.SparkCatalog \
--conf spark.sql.catalog.demo.uri=http://nessie:19120/iceberg/ \
--conf spark.sql.catalog.demo.warehouse=s3://my-bucket/ \
--conf spark.sql.catalog.demo.type=rest
The shell will be like this:

CREATE DATABASE demo.modern;

CREATE EXTERNAL TABLE demo.modern.person (
  id string,
  name string,
  age int
) USING iceberg;

INSERT INTO demo.modern.person VALUES
  ('v1', 'marko', 29),
  ('v2', 'vadas', 27),
  ('v4', 'josh', 32),
  ('v6', 'peter', 35);

CREATE EXTERNAL TABLE demo.modern.software (
  id string,
  name string,
  lang string
) USING iceberg;

INSERT INTO demo.modern.software VALUES
  ('v3', 'lop', 'java'),
  ('v5', 'ripple', 'java');

CREATE EXTERNAL TABLE demo.modern.created (
  id string,
  from_id string,
  to_id string,
  weight double
) USING iceberg;

INSERT INTO demo.modern.created VALUES
  ('e9', 'v1', 'v3', 0.4),
  ('e10', 'v4', 'v5', 1.0),
  ('e11', 'v4', 'v3', 0.4),
  ('e12', 'v6', 'v3', 0.2);

CREATE EXTERNAL TABLE demo.modern.knows (
  id string,
  from_id string,
  to_id string,
  weight double
) USING iceberg;

INSERT INTO demo.modern.knows VALUES
  ('e7', 'v1', 'v2', 0.5),
  ('e8', 'v1', 'v4', 1.0);
The above SQL creates the following tables:
| id | name | age |
|---|---|---|
| v1 | marko | 29 |
| v2 | vadas | 27 |
| v4 | josh | 32 |
| v6 | peter | 35 |
| id | name | lang |
|---|---|---|
| v3 | lop | java |
| v5 | ripple | java |
| id | from_id | to_id | weight |
|---|---|---|---|
| e7 | v1 | v2 | 0.5 |
| e8 | v1 | v4 | 1.0 |
| id | from_id | to_id | weight |
|---|---|---|---|
| e9 | v1 | v3 | 0.4 |
| e10 | v4 | v5 | 1.0 |
| e11 | v4 | v3 | 0.4 |
| e12 | v6 | v3 | 0.2 |
Modeling the Graph
Step 1: Connecting to Nessie

puppygraph as the username and puppygraph123 as the password.

Create graph schema to create a new graph schema.
Fill in the fields as follows.
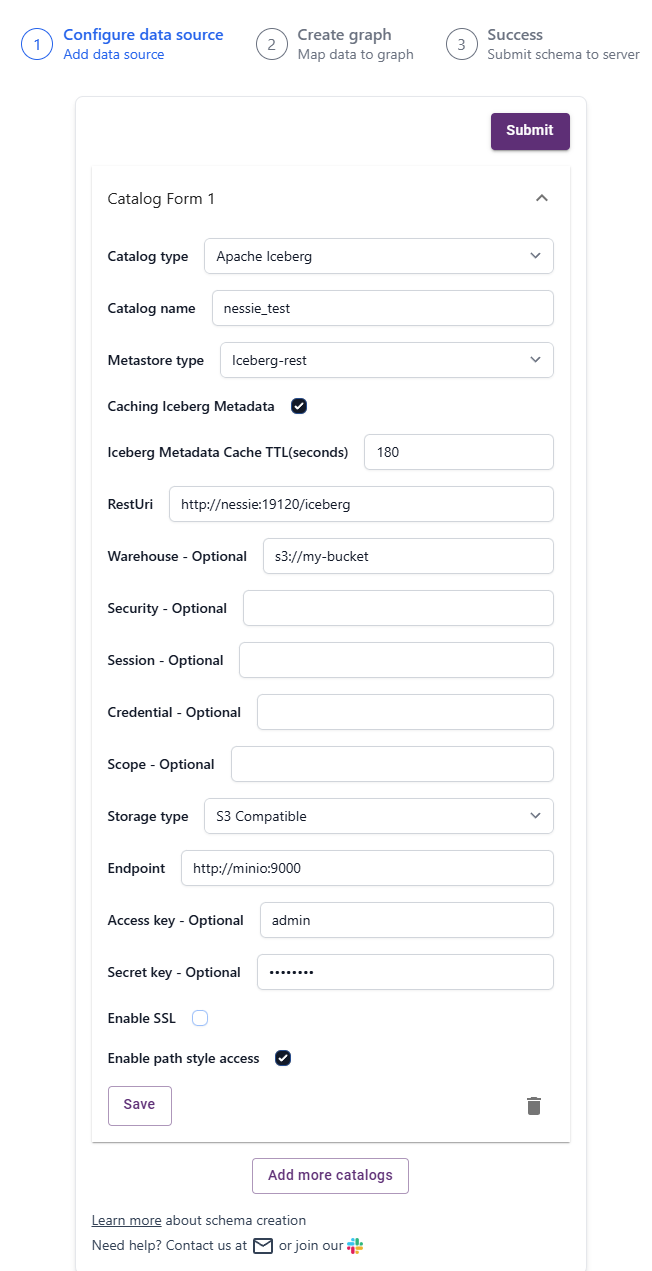
Create Nessie Catalog
| Parameter | Value |
|---|---|
| Catalog type | Apache Iceberg |
| Catalog name | Some name for the catalog as you like. |
| Metastore Type | Iceberg REST |
| RestUri | http://nessie:19120/iceberg. |
| Warehouse | Same as nessie.catalog.warehouses.warehouse.location in docker-compose.yaml. |
| Storage type | S3 Compatible |
| Endpoint | Same as nessie.catalog.service.s3.default-options.endpoint in docker-compose.yaml. |
| Access key | Same as AWS_ACCESS_KEY_ID in docker-compose.yaml |
| Secret key | Same as AWS_SECRET_ACCESS_KEY in docker-compose.yaml |
| Enable SSL | false |
| Enable path style access | true |

Save, then Click on Submit to connect to Nessie.
Step 2: Building the Graph Schema

Schema Builder, add the first node (vertex) to the graph from the table person.
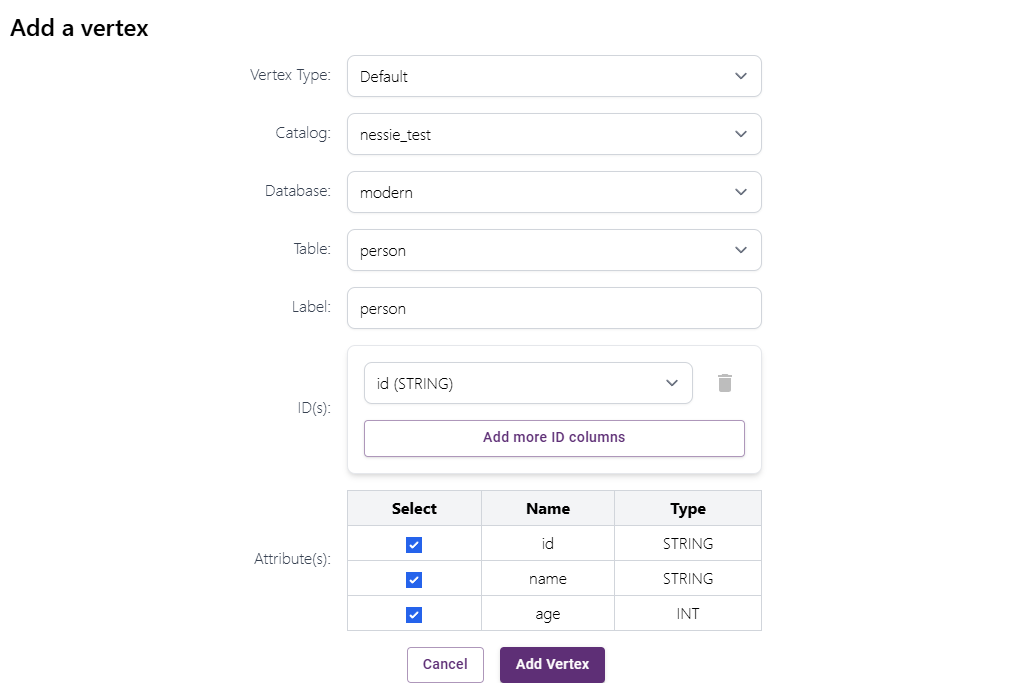

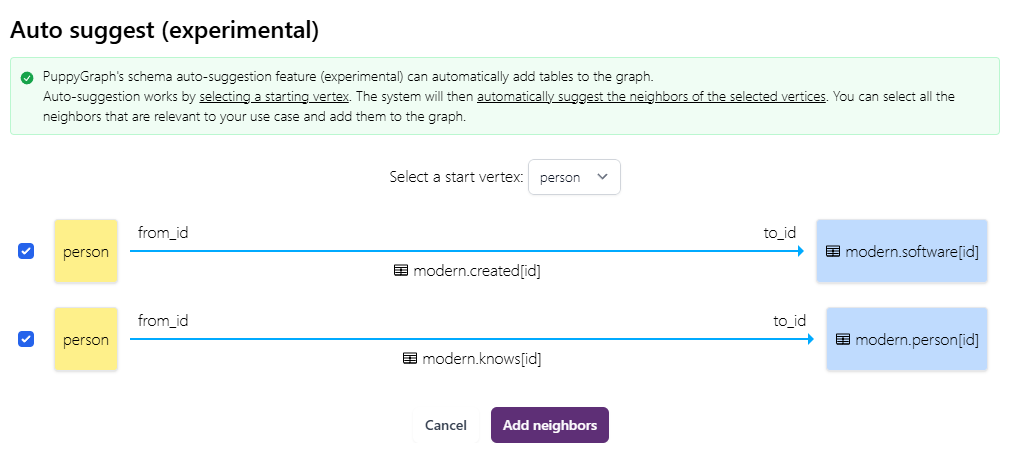
person as the start node (vertex) and add the auto suggested nodes and edges.
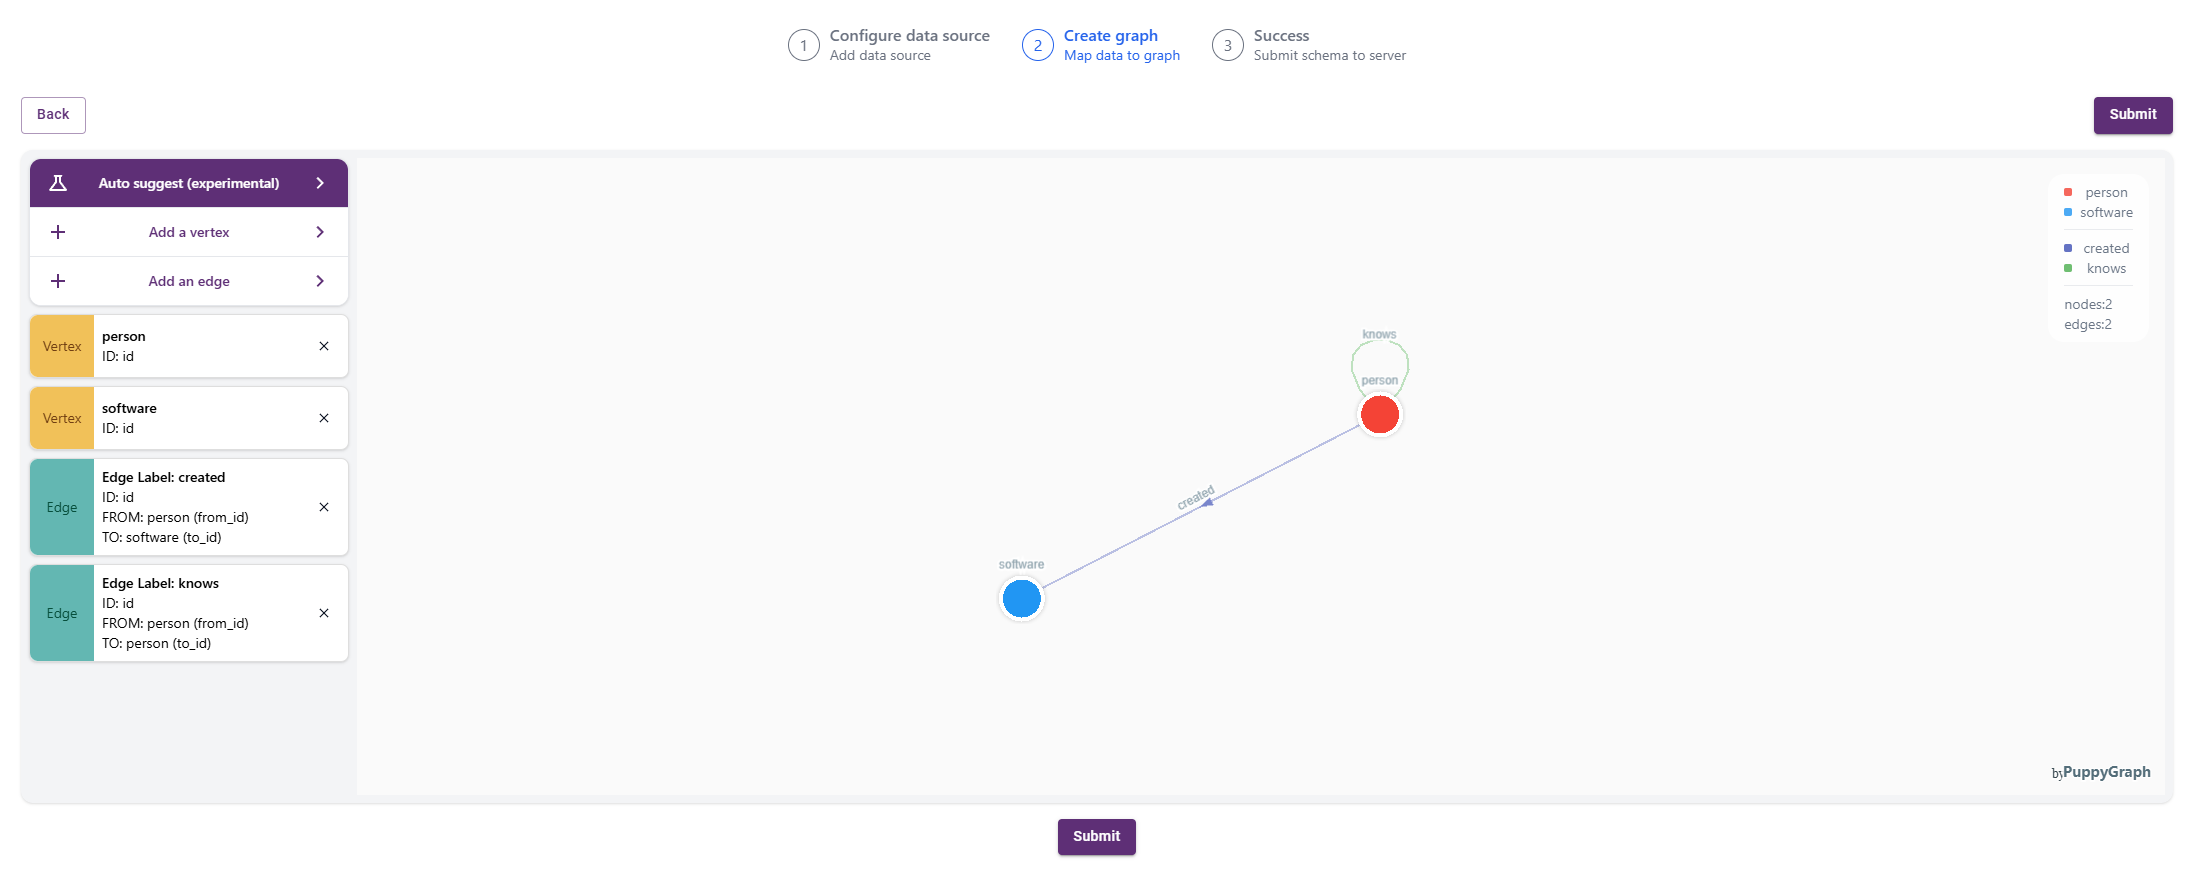
The graph schema should look like this:

Step 3: Querying the Graph
PuppyGraph provides a Dashboard that gives the summary of the graph.

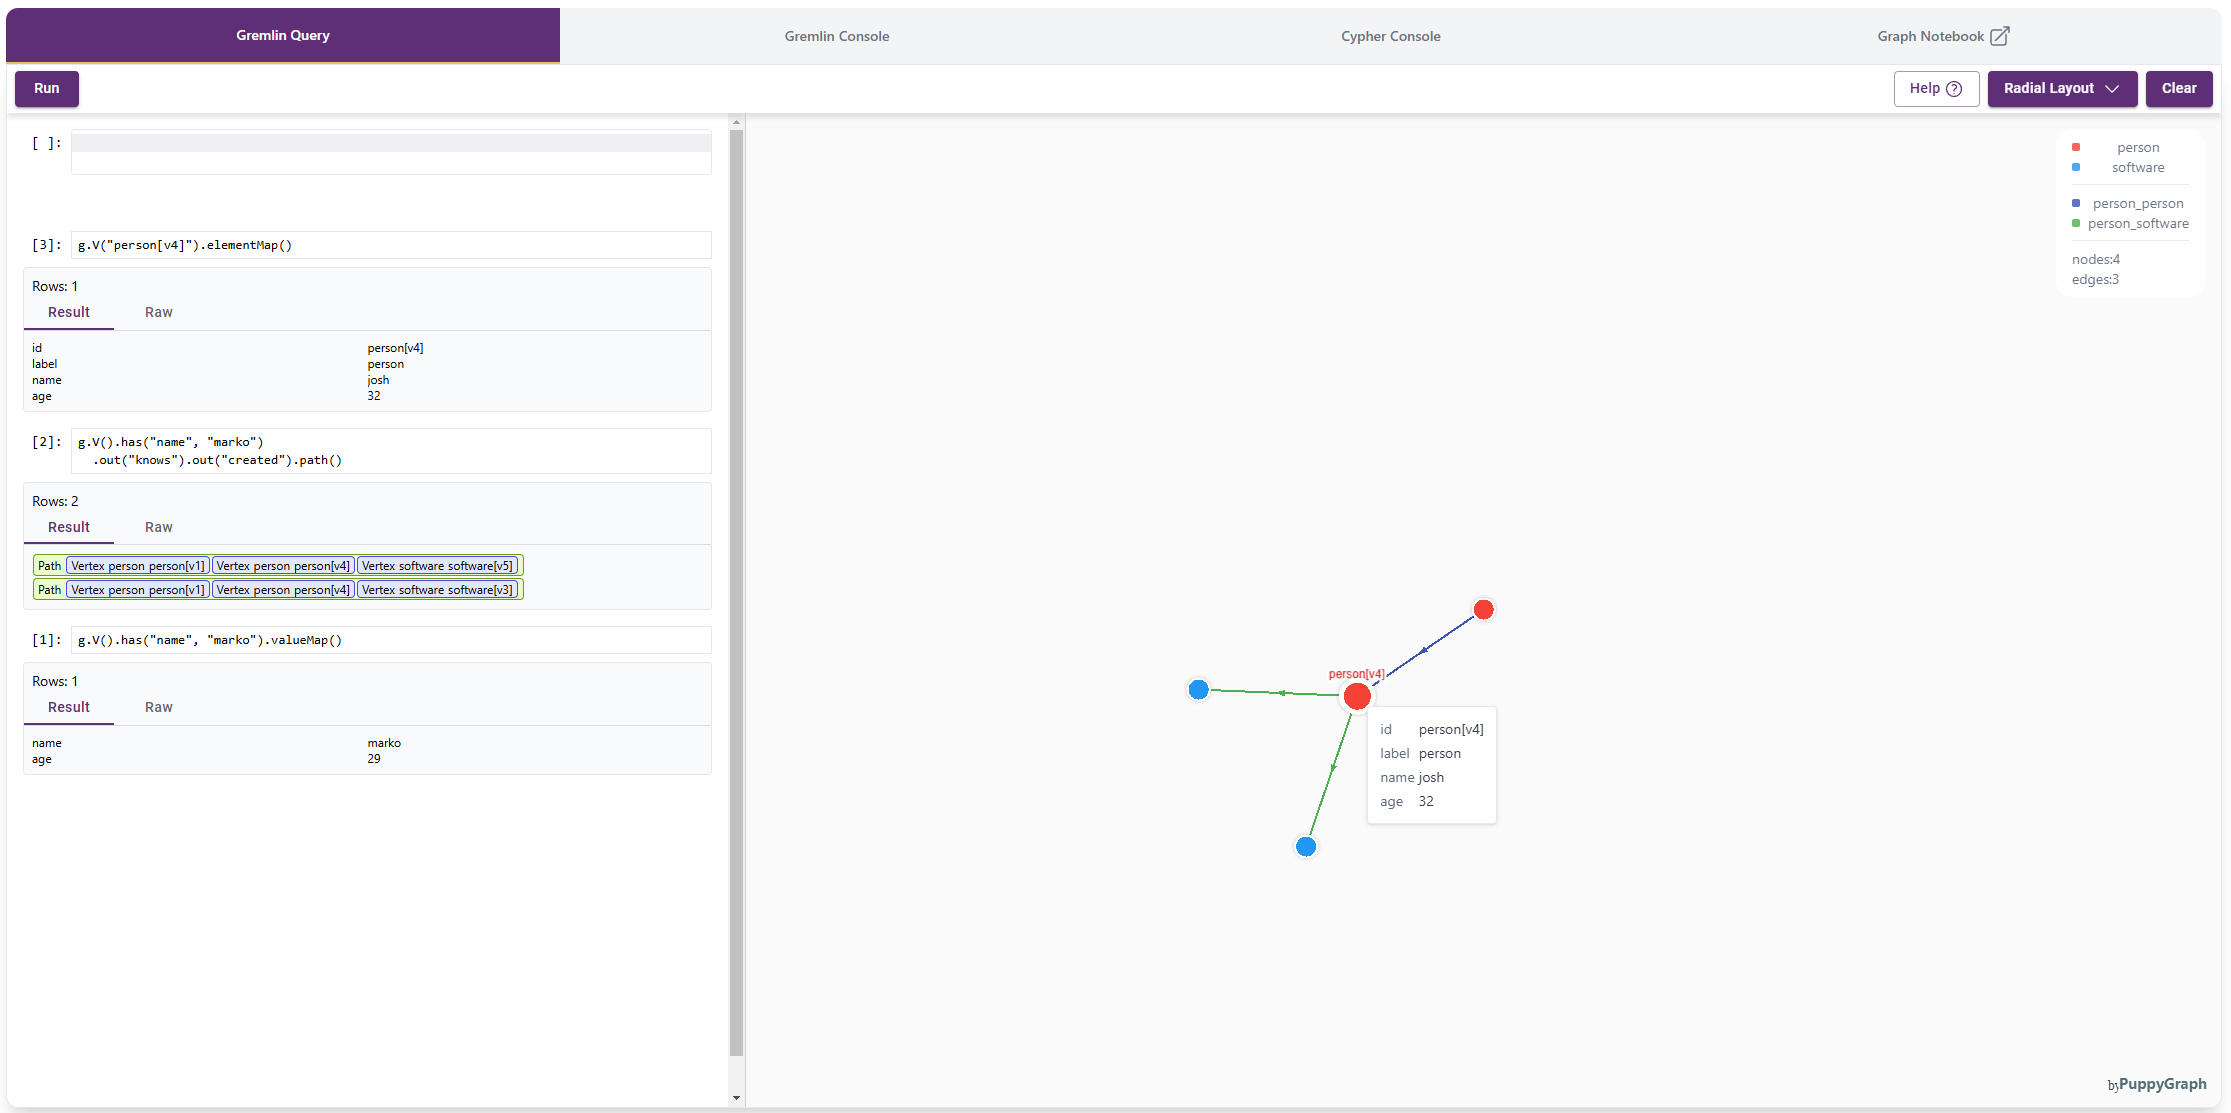
Use the Interactive Query UI to further explore the graph by sending queries.
Cleaning up
